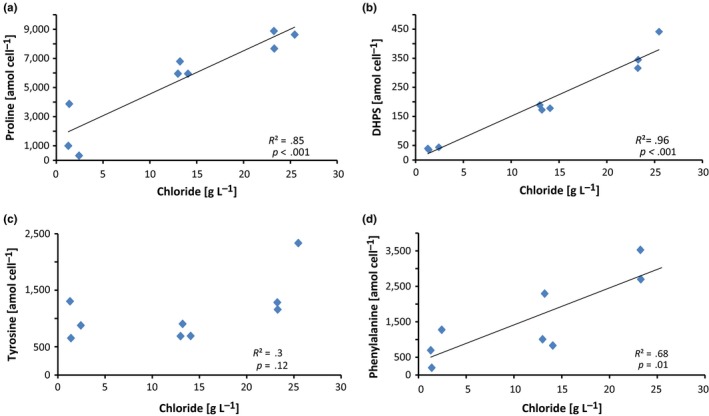
Figure 2.

Pearson's correlation between the intracellular metabolite concentration in amol per cell and the measured chloride ion concentration in g/L. Significant positive correlations were found for (a) proline (R 2 = .85, p < .001), and (b) 2,3‐dihydroxypropane‐1‐sulfonate (R 2 = .96, p < .001). While there was a positive trend for (c) tyrosine (R 2 = .3, p = .12), the correlation was not statistically significant. A positive correlation was also found for phenylalanine (R 2 = .68, p = .01) (d). Note: For one of the samples, the concentration of phenylalanine was above the saturation of the detector and thus was not included in the analysis
