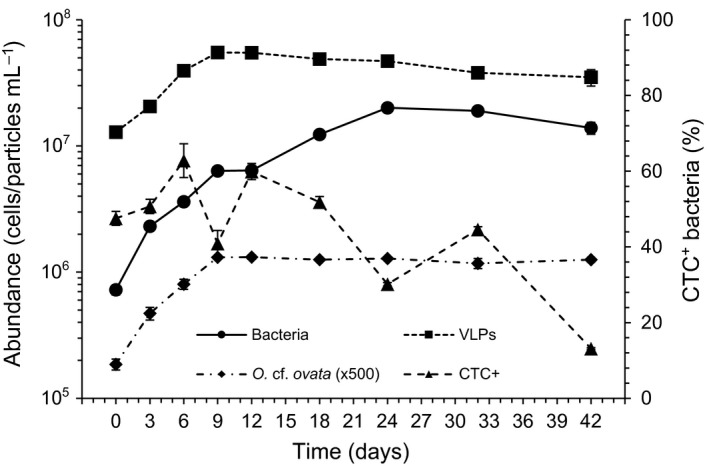
Figure 1.

Growth pattern of Ostreopsis cf. ovata and bacterial cells, temporal trend of the contribution (%) of highly respiring bacterial cells (CTC + cells) to the total bacterial abundance, and viral abundance (VLPs) trend. O. cf. ovata abundances are multiplied by a factor of 500. Each point is the mean of triplicate cultures. Bars indicate standard deviations
