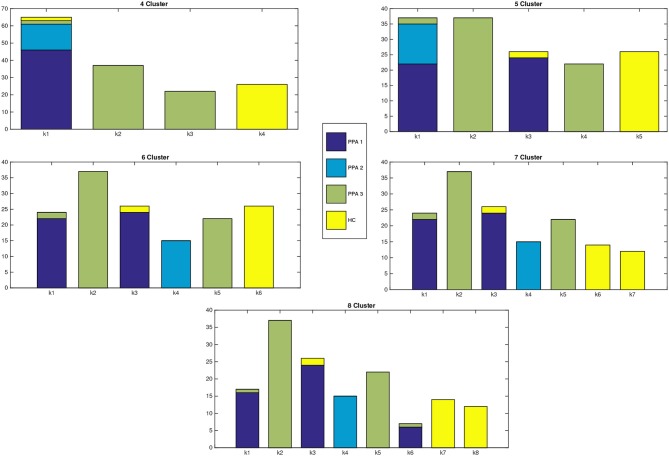
Figure 1.
Distribution of patients within each cluster. X-axis represents the number of clusters, while in the Y-axis we show the number of patients assigned to each cluster. The different colors of the bars indicate the clinical PPA diagnosis for each patient within the cluster (1 non-fluent/agrammatic, 2 semantic, 3 logopenic) and healthy controls.

