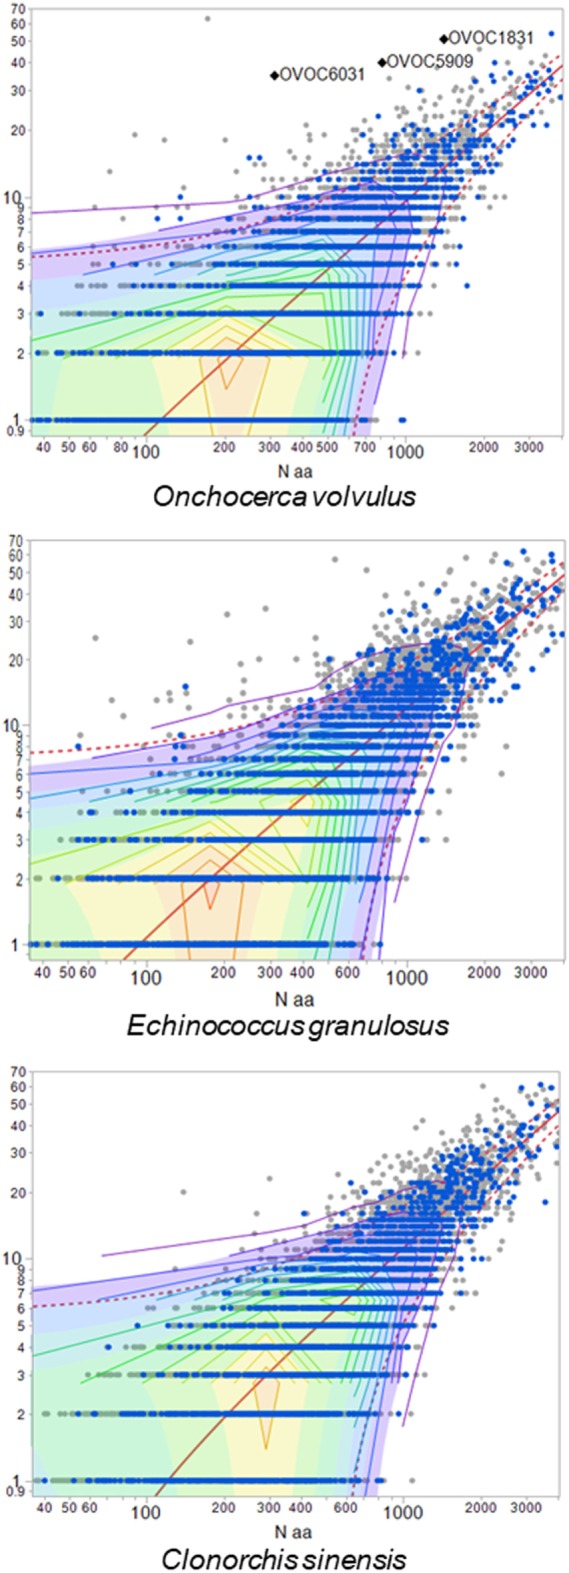
Figure 2.

Proteins with high content of common T-cell-exposed motif (TCEM). Each dot represents one protein of the species indicated. X-axis shows size of the protein (log10 amino acid number). Y-axis shows number of TCEM IIA motifs of higher than FC10, i.e., occurring more often than the mean in an immunoglobulinome reference database. Proteins shown in blue are secreted and surface proteins. Three example Onchocerca volvulus proteins are labeled, and sequences for these provided in Figure S3 in Supplementary Material.
