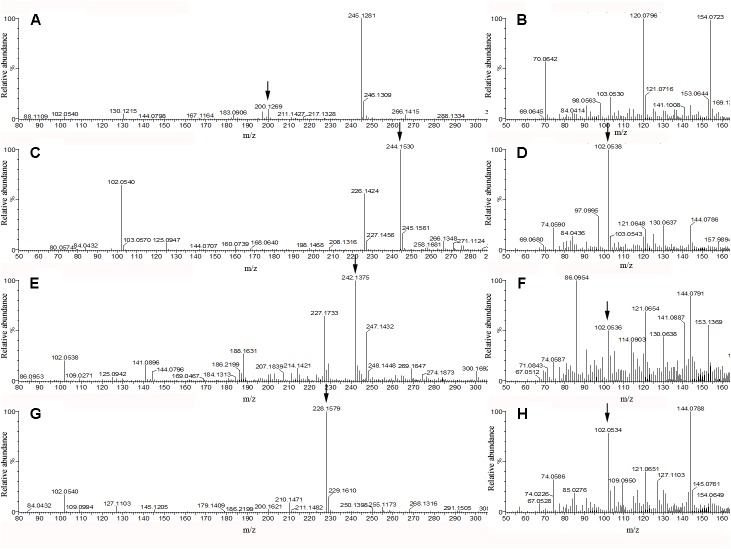
FIGURE 4.
QTOF-MS spectra of four AHLs of A. veronii LP-11 extract. Panels (A,B) were the MS1 spectra and MS2 spectra, respectively of m/z 200.1269 ion; panels (C,D) were the MS1 spectra and MS2 spectra, respectively of m/z 244.153 ion; panels (E,F) were the MS1 spectra and MS2 spectra, respectively of m/z 242.1375 ion; and panels (G,H) were the MS1 spectra and MS2 spectra, respectively of m/z 228.1579 ion.

