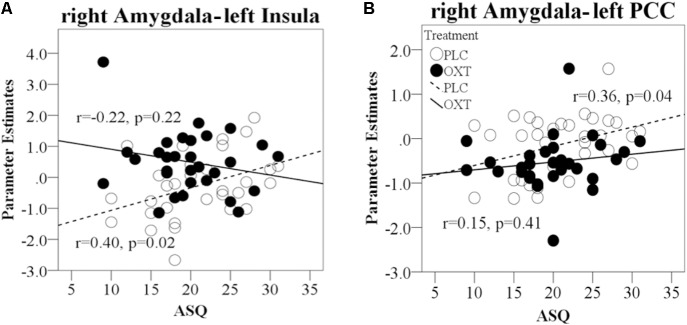
FIGURE 8.
Regression plots for correlations of ASQ scores with amygdala responses and functional connectivity during EE trials in OXT and PLC groups. (A) Correlation between right amygdala–left PCC functional connectivity during negative EED trials and total ASQ score. (B) Correlation of right amygdala functional connectivity with left insula cortex during positive EE trials and total ASQ score. In all cases, significant positive correlations during PLC administration are absent in the OXT group.

