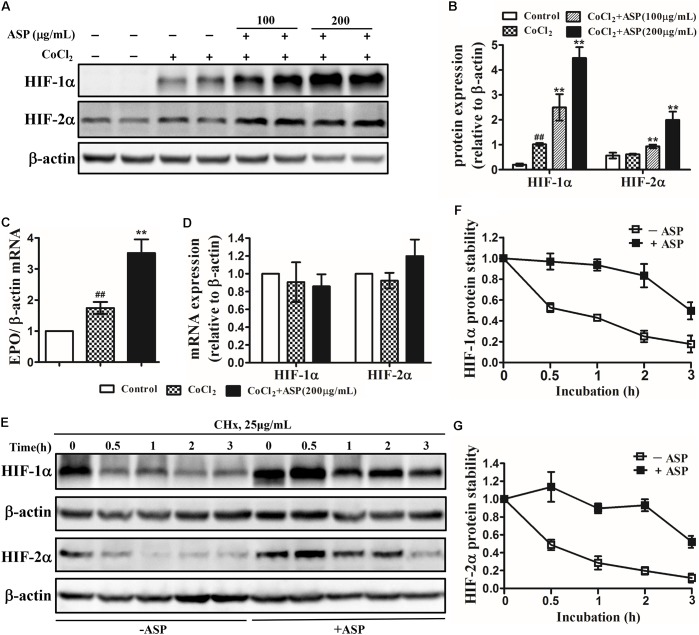
FIGURE 2.
Effects of ASP on HIF-1α and HIF-2α expression, EPO mRNA expression and HIF-1α and HIF-2α protein stability in hypoxic Hep3B cells. Analyses of (A,B) HIF-1α and HIF-2α protein expression, (C) EPO mRNA expression, and (D) HIF-1α and HIF-2α mRNA expression. (E–G) Hep3B cells were treated with or without 200 μg/mL ASP in the presence of 50 μM CoCl2 for 24 h. Then, the cells were harvested at 0, 0.5, 1, 2, and 3 h following the addition of 25 μg/ml cycloheximide (CHx) to determine HIF-1α and HIF-2α protein levels by western blot analysis. (F) HIF-1α and (G) HIF-2α expression was corrected for β-actin and normalized such that the band intensity in lane 0 h was set at one. One representative blot out of three independent experiments is shown β-actin served as the loading control. Values are means ± SEM from three independent experiments. ##P < 0.01 compared with the control group; ∗∗P < 0.01 compared with the CoCl2 group. Open diamond, without ASP treatment; closed diamond, with ASP treatment.

