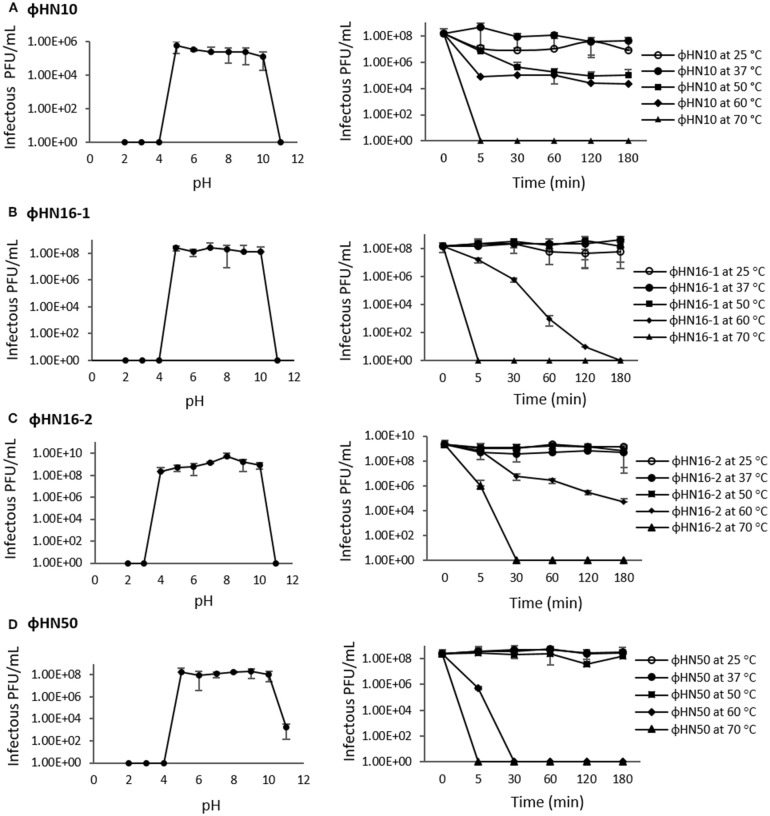
Figure 1.
pH and thermal stability test of phages. The first panel represented phage infectivity after incubation at different pH ranging from pH 2 to pH 11 at 37°C for 180 min. The second panel represented phage infectivity after treated with different temperature as indicated time point. Phage titer were enumerated by spot-titer assay. (A–D) represent phages ΦHN10, ΦHN16-1, ΦHN16-2, and ΦHN50, respectively.

