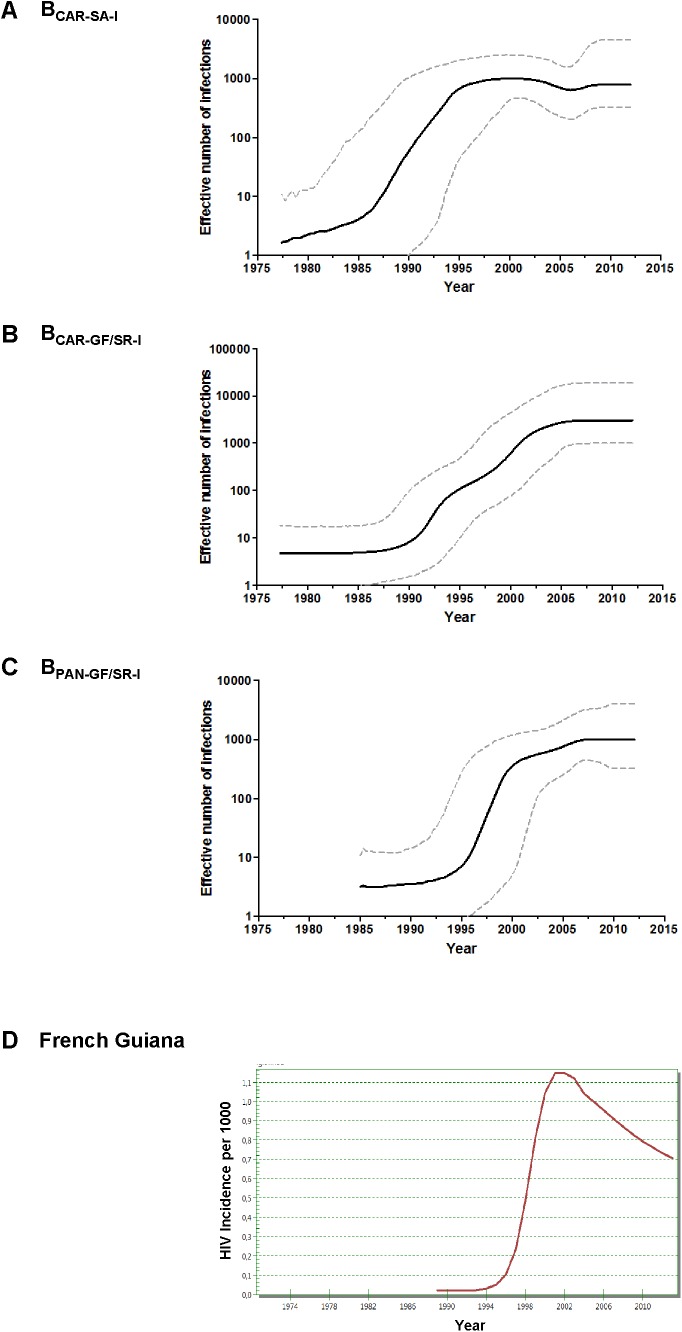
FIGURE 3.
(A–C) Demographic history of major HIV-1 BCAR and BPANDEMIC lineages (n > 30 sequences) circulating in French Guiana and Suriname. Mean estimates of the effective number of infections (Ne) (solid line) are shown together with the 95% HPD intervals (dashed curves) of the Bayesian skyline plot for lineages BCAR-SA-I (A), BCAR-GF/SR-I (B), and BPAN-GF/SR-I (C). The vertical axes represent the estimated Ne on a logarithmic scale. Time scales are in calendar years. (D) Spectrum-estimated national HIV incidence temporal trend in French Guiana.

