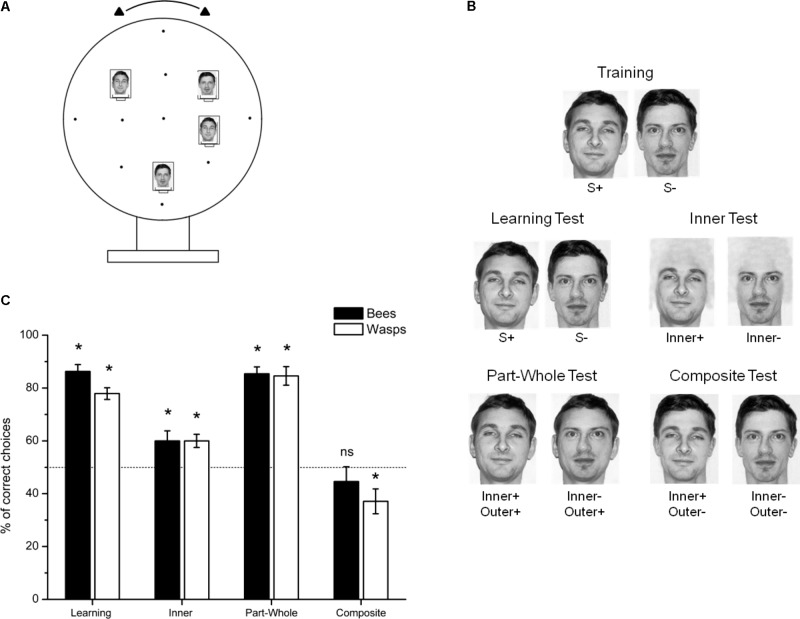
FIGURE 1.
Experiment with human face pictures. (A) Schematic representation of the experimental setup. (B) Stimuli used for training and the non-reinforced tests. (C) Mean ± SEM percentage of choices for the correct stimulus on the 20 total test choices in each of the non-reinforced tests. The black bars show honeybees results (N = 12) while the white bars represent the wasps results (N = 12). The dashed line indicates chance level (∗p < 0.05). The pictures are used and reproduced with permission from Psychology Press, the original publisher (Warrington, 1996).

