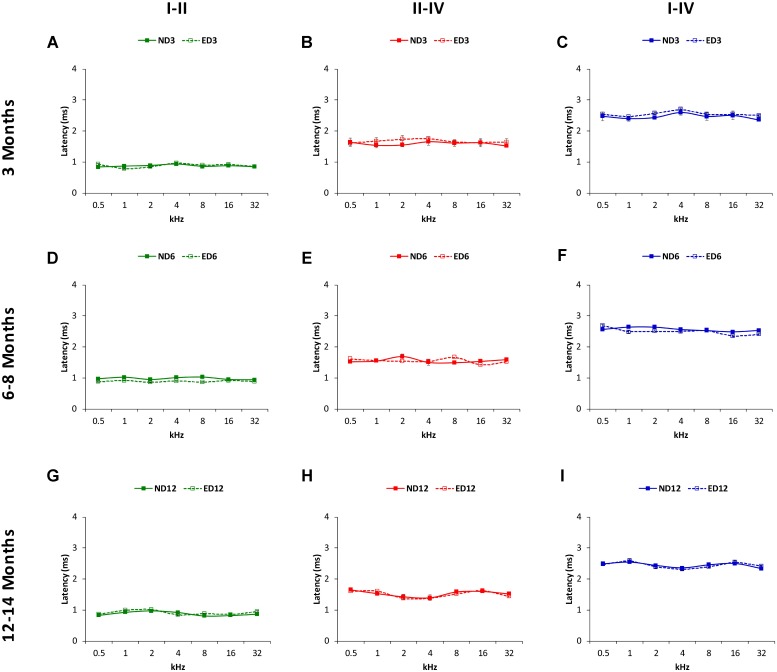
FIGURE 10.
Line graphs illustrating interpeak negative latencies (in ms) plotted as a function of frequency in ND and ED rats. Similar to interpeak positive latencies, no significant differences were observed at any stimulus frequency, when ND3 vs. ED3 (A–C), ND6 vs. ED6 (D–F) and ND12 vs. ED12 (G–I) were compared.

