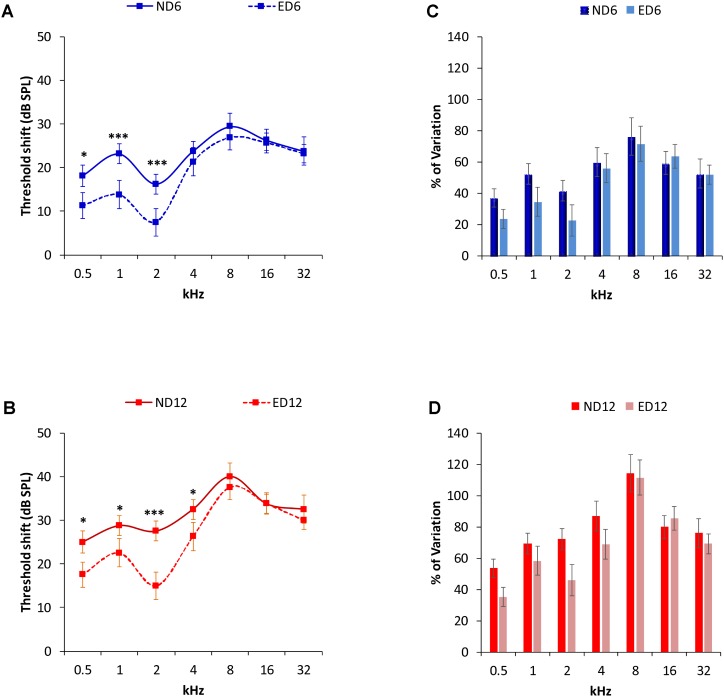
FIGURE 2.
Auditory threshold shifts (line graphs) and percentage of variation (bar graphs) between ND and ED rats at 6–8 (A,C) and 12–14 months (B,D). At 6–8 (A) and at 12–14 (B) months of age, threshold shifts in ED animals were smaller than those in ND animals in the lower and medium frequencies. No significant differences were observed at higher frequencies. The percentage of variation of the threshold shifts at 6–8 months of age (C), were smaller in ED rats compared to those in ND rats, being 13.35, 17.74, and 18.77%, at 0.5, 1, and 2 kHz respectively. In the remaining frequencies, differences ranged from –4.64 to 4.28% (C). In 12–14 month-old animals (D), the percentage of variation of the threshold shifts in ED rats were smaller than those in ND rats. Percentages were 18.43, 11.08, 26.19, and 18.13% at 0.5, 1, 2, and 4 kHz; respectively, while at higher frequencies the differences ranged from –6.94 to 5.56%. ∗p < 0.05, ∗∗∗p < 0.001.

