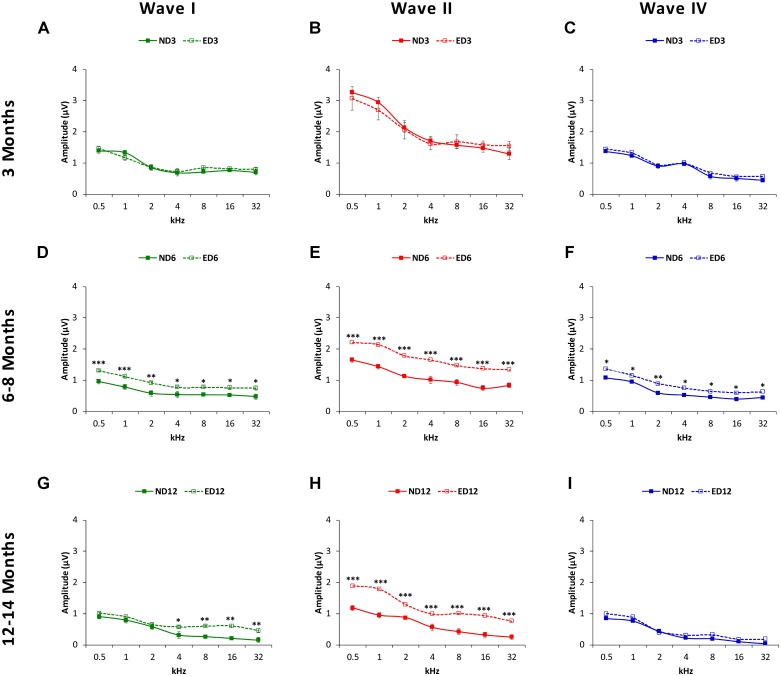
FIGURE 4.
Line graphs depicting wave amplitudes (in μV) plotted as a function of frequency in ND (solid lines) and ED (dashed lines) rats at the different ages evaluated. At 3 months of age (A–C), the mean values of the largest waves (I, II, and IV) were similar in both groups, with larger wave amplitudes in the lower frequencies and smaller at medium and higher frequencies, being wave II the largest of all. In 6–8-month-old rats (D–F), the mean amplitudes of all waves were reduced, but values in ED rats were significantly larger compared to ND rats. At 12–14 months (G–I), while the reduction in the mean amplitudes of all waves persisted, in the ED group values of wave II at all frequencies (H) and of wave I at higher frequencies (G) were still larger than those observed in ND animals. No differences were observed in wave IV (I). ∗p < 0.05, ∗∗p < 0.01, ∗∗∗p < 0.001.

