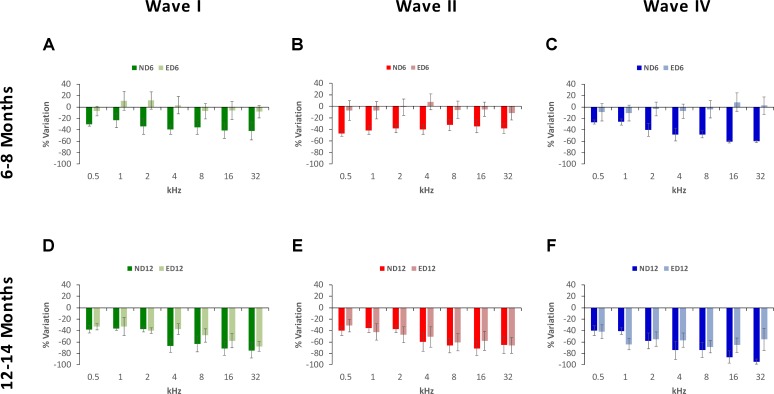
FIGURE 5.
Bar graphs illustrating the percentage of variation in the wave amplitudes in older rats relative to the control condition (3-month-old rats). At 6–8 months of age, the percentage of variation in the wave amplitudes in ND rats was greater than in ED rats. These values in ND rats ranged from –23.48 to –42.11% for wave I (A), from –32.00% to –47.07% for wave II (B) and from –26.31 to 60.51% for wave IV (C), while in ED rats they ranged from –8.36 to 11.44% for wave I (A), from –11.22 to 7.81% for wave II (B), and from –10.30 to 8.60% for wave IV (C). At 12–14 months of age, while variations relative to controls were larger, differences between both groups were reduced. In ND rats, these values fluctuated from –36.52 to –71.58% for wave I (D), from –35.71 to –71.19% for wave II (E) and from –39.91 to 94.30% for wave IV (F). Meanwhile, in ED rats, they ranged from –32.67 to 67.84% for wave I (D), from 31.46 to 65.95% for wave II (E) and from –41.78 to 68.40% for wave IV (F).

