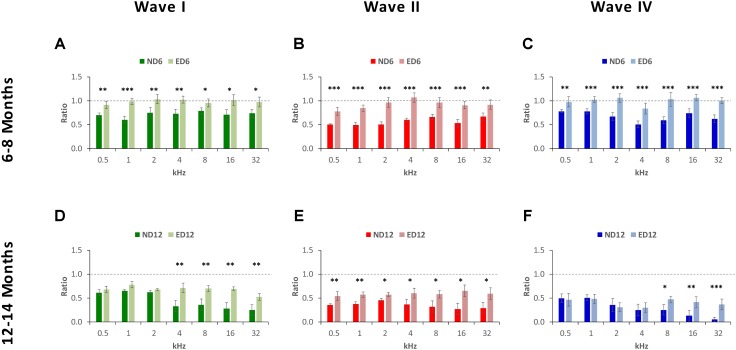
FIGURE 6.
Bar graphs illustrating the wave amplitude ratio in older animals relative to the control condition. In ND rats at 6–8 months of age, the wave amplitude ratios for waves I (A), II (B), and IV (C) were smaller at all frequencies when compared to ED rats. In ND rats at 12–14 months of age, compared to ED rats, ratios were still smaller for wave II (E) at all frequencies assessed and for waves I (D) and for wave IV (F) at the higher frequencies. ∗p < 0.05, ∗∗p < 0.01, ∗∗∗p < 0.001.

