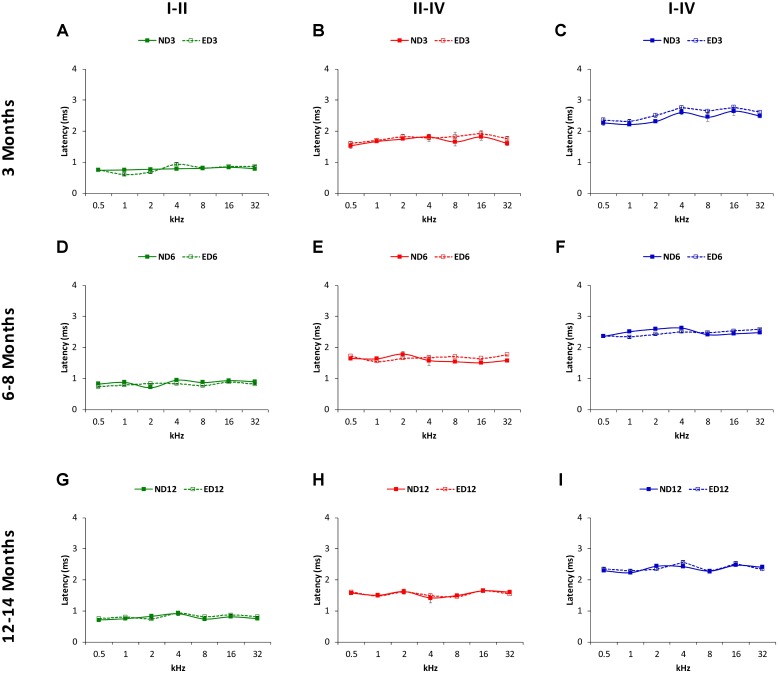
FIGURE 9.
Line graphs illustrating interpeak positive latencies (in ms) plotted as a function of frequency in ND and ED rats. Regardless the age of the animal, the mean values of the interpeak positive latencies observed at 3 (A–C), 6–8 (D–F), and 12–14 (G–I) months were similar in ND and ED rats at all frequencies evaluated.

