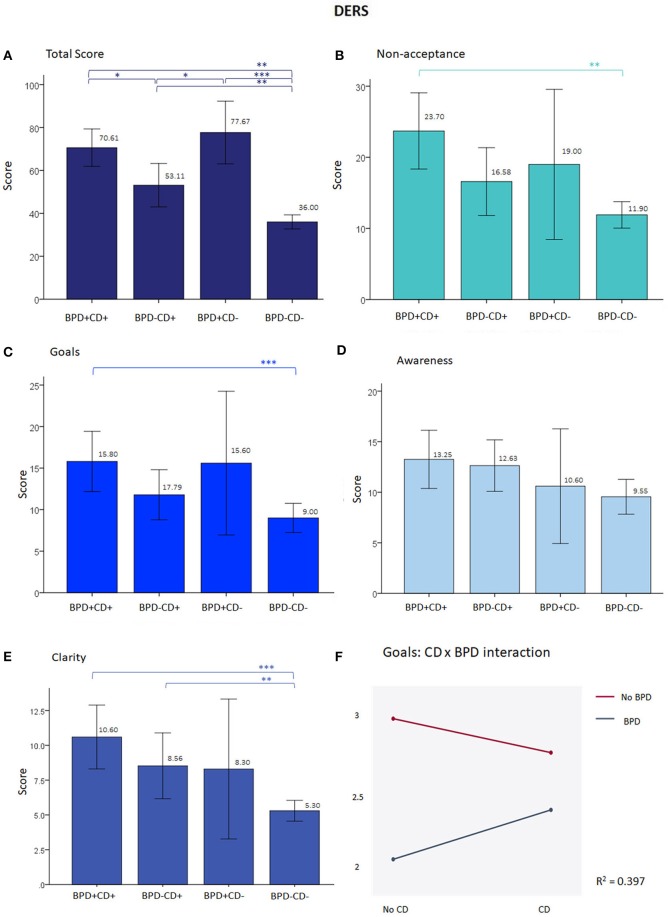
Figure 2.
Results from the DERS. (A) At total scores, besides the difference between each clinical group and the BPD−CD− group, the difference is near significance between the BPD-CD+ and the BPD+CD+ groups, and the former with the BPD+CD−. (B–C) show graphs with a similar shape than (A), but without the significant results. (D) There were no differences between groups in awareness subscale. (E) For clarity subscale only CD groups differed from BPD-CD-. (F) Negative significant interaction from the ANOVA at goals subscale (F = 6.19, p = 0.05) and in the borderline personality disorder factor (F = 34.84, p < 0.001). When adding cigarettes/day as covariate, the R2 improves to 0.421, remaining the interaction significant (F = 5.33, p < 0.05) and the BPD factor (F = 32.04, p < 0.001), but not the covariate. On (A–C) p-value corrected for multiple comparisons to < 0.01. *p < 0.05, **p < 0.01, ***p < 0.001. DERS, Difficulties in Emotion Regulation Scale; BPD, borderline personality disorder; CD, Cocaine dependence.

