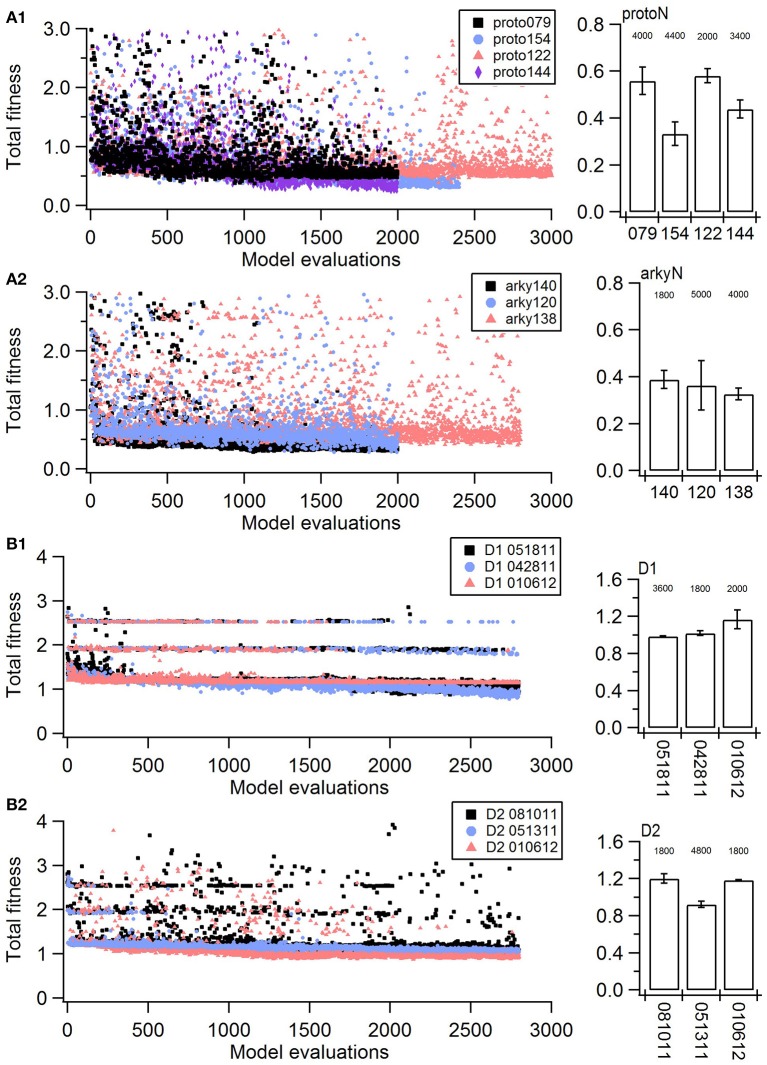
Figure 1.
Fitness history shows the fitness values rapidly reach good fits (within 1,000 model evaluations/sample points) and reaches an asymptote typically within 2,000 model evaluations/sample points). (A) Fitness vs. model evaluation for GPe neurons of (A1) prototypical type and (A2) arkypallidal type. (B) Fitness vs. model evaluation for SP neurons of (B1) D1 type and (B2) D2 type. Note that GPe neuron fitness values reached considerably lower values than SP neuron fitness values. Right panels show fitness vs. model evaluation for the 1st set of optimizations and left panels show the mean and standard deviation of the fitness values of the last 25 generations of the 2nd set of optimizations (which used a different random seed). The number above the bar gives the number of model evaluations to convergence for the 2nd set of optimizations.

