Figure 4.
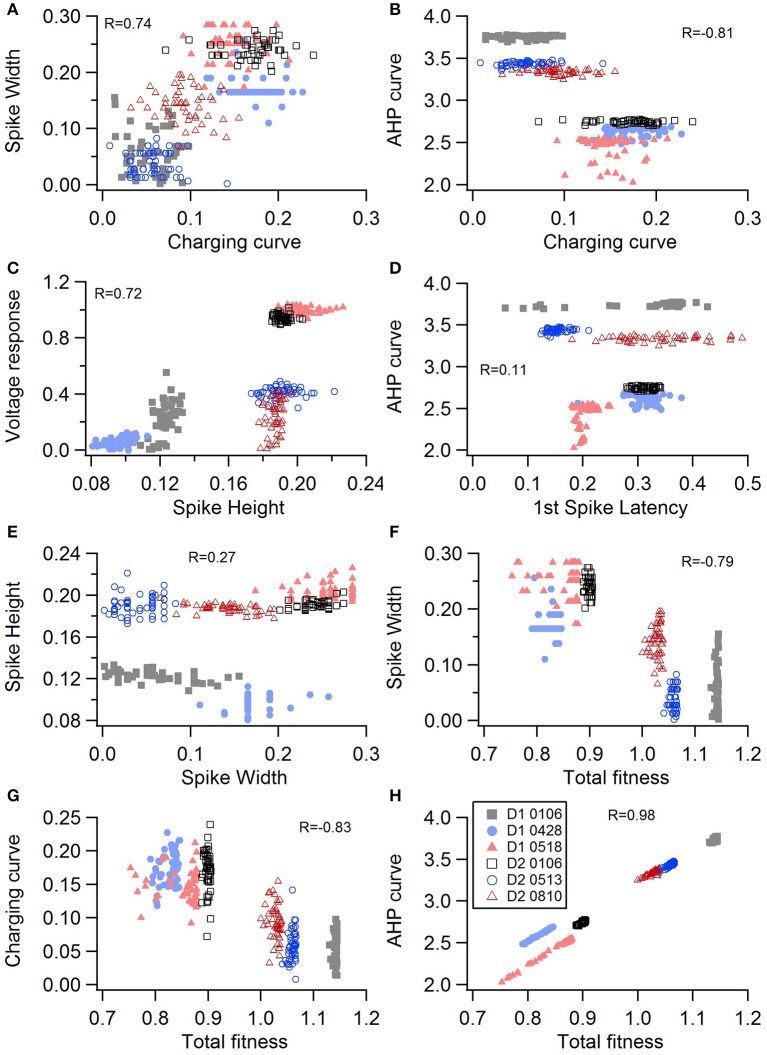
Comparison of feature fitnesses for 50 best models for SP neuron optimizations. The positive correlations for (A) spike width vs. charging curve fitness and (C) voltage response vs. spike height show that two features can improve simultaneously. With some features, such as (B) AHP curve vs. charging curve fitness, there is a trade-off between these two features.(D) AHP curve is not correlated with 1st spike latency (P = 0.052). (E) Spike height vs. spike width does not appear to be correlated in the SP neurons, though reaching statistical significance (P < 0.0001). (F–H) Contribution of spike width (F), charging curve (G), and AHP curve (H) to the total fitness. Improvement in spike width is negatively correlated with total fitness. The strong correlation of AHP curve to total fitness is likely caused by strong weight on AHP curve in the fitness function. R is the Pearson's R correlation; Correlations above 0.7 are significant at P < 0.0001. Symbols corresponding to different neurons are the same in all panels and indicated in H.

