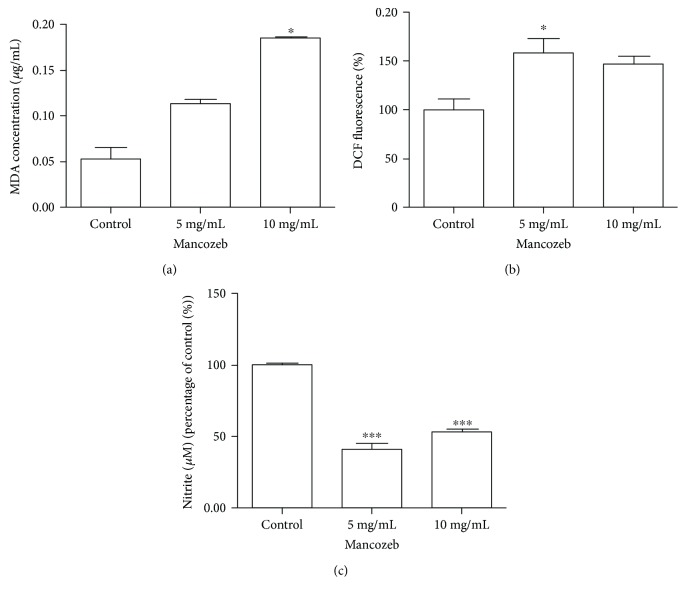
Figure 3.
Effects of MZ exposure on MDA levels, arbitrary steady-state ROS levels, and nitric oxide levels. (a) MDA levels were evaluated after 15 days of exposure by HPLC on a fly homogenate. (b) ROS levels were evaluated by DCF-DA fluorescence. (c) Nitric oxide production was evaluated by a colorimetric assay based on mitrite presence. All experiments were repeated three times and performed in triplicate. ∗P < 0.05 and ∗∗∗P < 0.0001. Results are presented as means ± SEM, from 3 different preparations.

