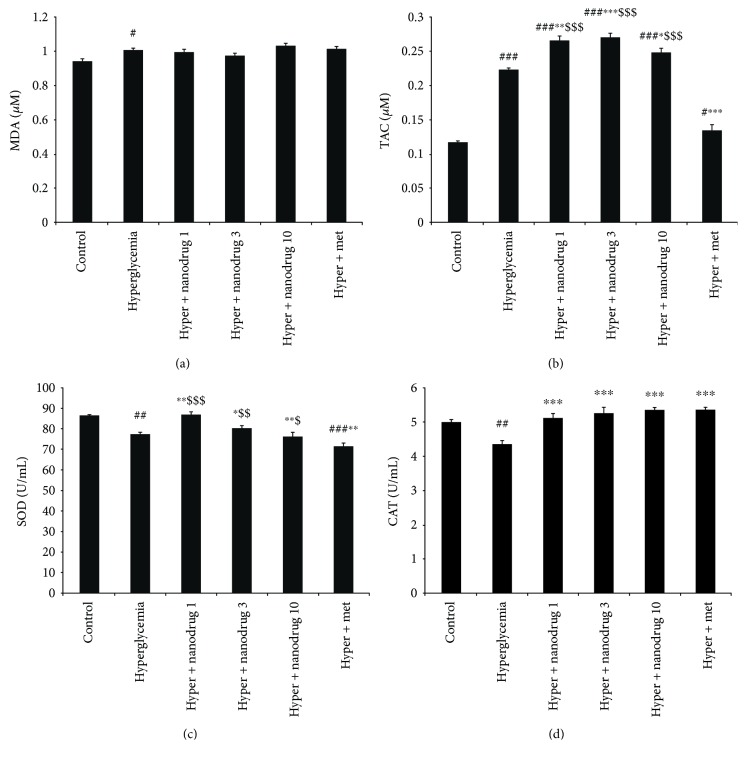
Figure 5.
Effect of myricitrin SLN on MDA, TAC, and antioxidant enzyme level of C2C12 cell. Data are presented as mean ± SE; n = 3; #p < 0.05, ##p < 0.01, and ###p < 0.001 compared with control; ∗p < 0.05, ∗∗p < 0.01, and ∗∗∗p < 0.001 compared with hyperglycemia; $p < 0.05, $$p < 0.01, and $$$p < 0.001 compared with hyperglycemia + metformin (one-way analysis of variance (ANOVA), followed by post hoc least significant difference (LSD) tests). (a) MDA, (b) TAC, (c) SOD, and (d) CAT.

