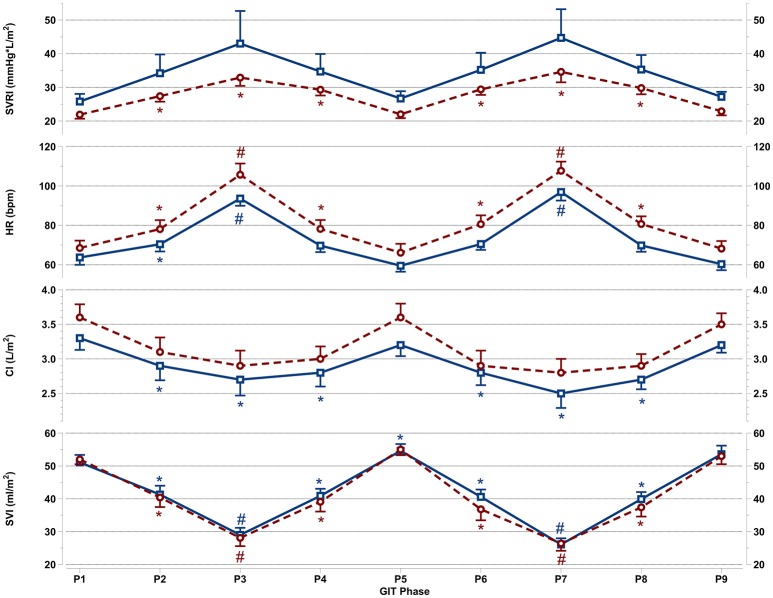
Figure 3.
Mean and SEM for vascular resistance and cardiac reactions of the last 60 s per +Gz phase from top to bottom: SVRI systemic vascular resistance, HR heart rate, CI cardiac index, and SVI stroke volume index for men (blue squares solid lines n = 12) and women (red circles spaced lines n = 11) during GIT. *Denotes a significant change from baseline P1 (p < 0.05), and #indicates a significant change between +2Gz and +1Gz phases (p < 0.05). GIT phase nomenclature is indicated along the x-axis (P1-P9).

