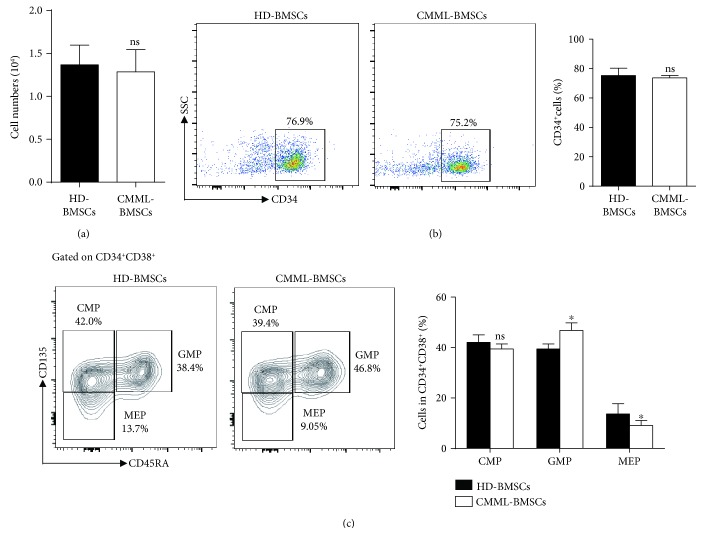
Figure 2.
Analysis of cells in the upper chamber after a 3-day transwell coculture of CB CD34+ cells with HD-BMSCs or CMML-BMSCs. (a) Quantitation of cell numbers in the upper chamber after a 3-day coculture. (b) Flow cytometric analysis of CD34+ cell populations in the upper chamber after a 3-day coculture of CB CD34+ cells with HD-BMSCs or CMML-BMSCs. Quantification of the percentage of CD34+ cell population in the upper chamber is shown in the bar graph. (c) Flow cytometric analysis of CMP, GMP, and MEP populations in the upper chamber after a 3-day coculture of CB CD34+ cells with HD-BMSCs or CMML-BMSCs. Quantification of the percentage of CMP, GMP, and MEP populations in the upper chamber is shown in the bar graph (n = 5). Data are presented as the mean ± SEM, ∗ p < 0.05; ns: not significant.

