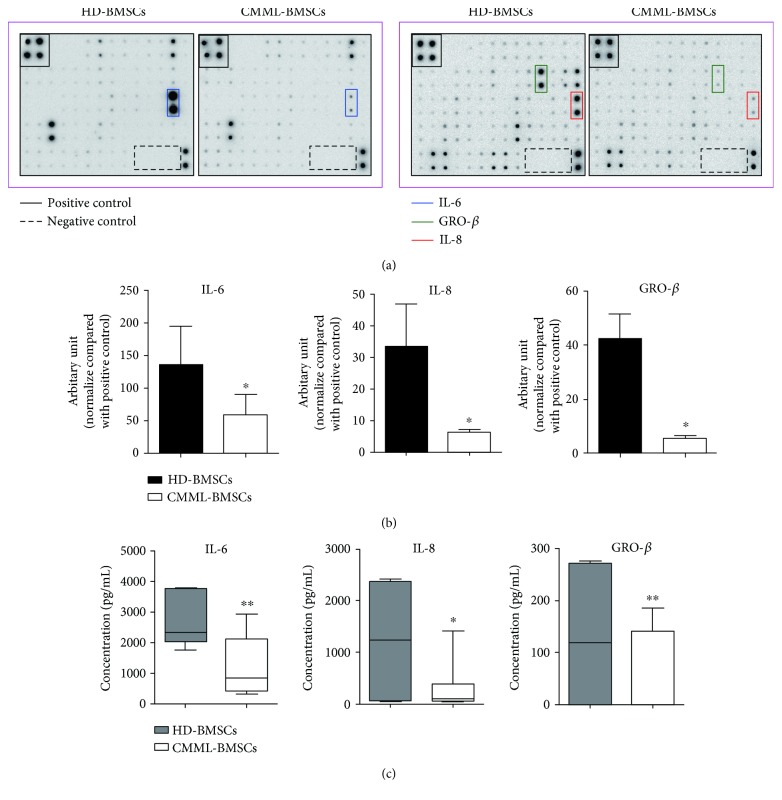
Figure 4.
Comparison of cytokine secretion in CMML-BMSCs and HD-BMSCs. Cytokine array was performed to analyze the expression levels of soluble cytokines between HD-BMSCs and CMML-BMSCs. (a) Representative photographs showed that IL-6 (surrounded by blue lines), IL-8 (surrounded by red line), and GRO-β (surrounded by green line) significantly decreased in CMML-BMSCs compared with HD-BMSCs. (b) Quantitative analysis of the cytokine array using IQTL 7.0 software. Data are presented as the mean ± SEM (n = 5), ∗ p < 0.05. (c) ELISA assay was performed to validate the altered cytokine secretion in cytokine array (HD-BMSCs, n = 6; CMML-BMSCs, n = 7). Data are presented as the mean ± SEM, ∗ p < 0.05 and ∗∗ p < 0.01.

