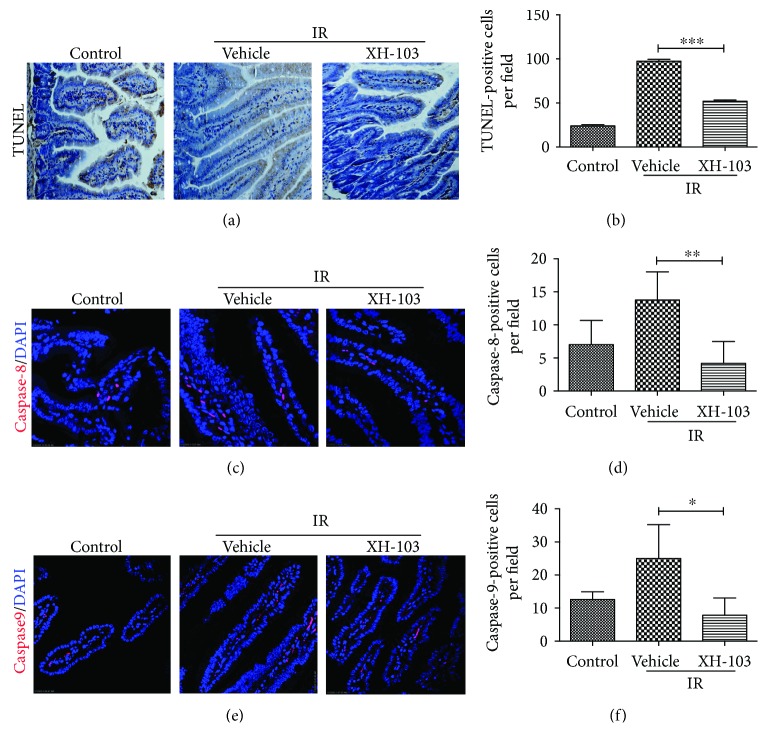
Figure 5.
XH-103 reduces the apoptosis of the small intestine after TBI. (a) Apoptosis was assayed by TUNEL staining. (b) The number of TUNEL-positive cells was quantified per field. The paraffin-embedded sections of the small intestine were analyzed by immunofluorescence. (c) Representative DAPI and caspase-8-staining images of the small intestine (red, caspase-8; blue, DAPI). (d) Caspase-8-positive cells in a single field of view were quantified. (e) Photomicrograph of caspase-9-staining images of the small intestine (red, caspase-9; blue, DAPI). (f) Bar graph showing quantitative analysis of caspase-9-positive cells per field of view. The results are represented as mean ± SEM, n = 5 mice per group. ∗ p < 0.05, ∗∗ p < 0.01, ∗∗∗ p < 0.005. Scale bar: 50 μm and 10 μm.

