Figure 2.
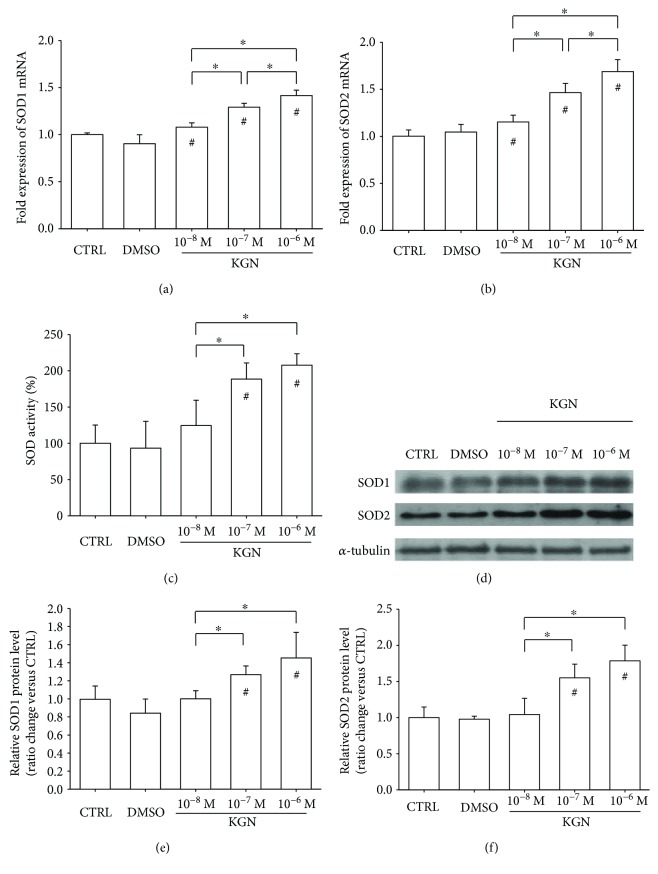
The effect of KGN on the expression and activity of superoxide dismutases. (a–b) The mRNA levels of SOD1 (a) and SOD2 (b) were measured using real-time RT-PCR. Values are the mean ± SEM of four independent experiments (n = 4) in real-time RT-PCR experiments. (c) Treatment with KGN at 10−7 M and 10−6 M increased the activity of SOD in BM-MSCs. Values are the mean ± SEM of four independent experiments (n = 4) in SOD activity experiments. (d) The increase in protein levels of SOD1 and SOD2 in KGN-treated BM-MSCs were confirmed using Western blot assays. (e–f) Quantification of protein levels of SOD1 (e) and SOD2 (f). Values are the mean ± SEM of three independent experiments (n = 3) in Western blot assays. Statistically significant differences are indicated by ∗ where p < 0.05 between the indicated groups and # where p < 0.05 versus the CTRL group.

