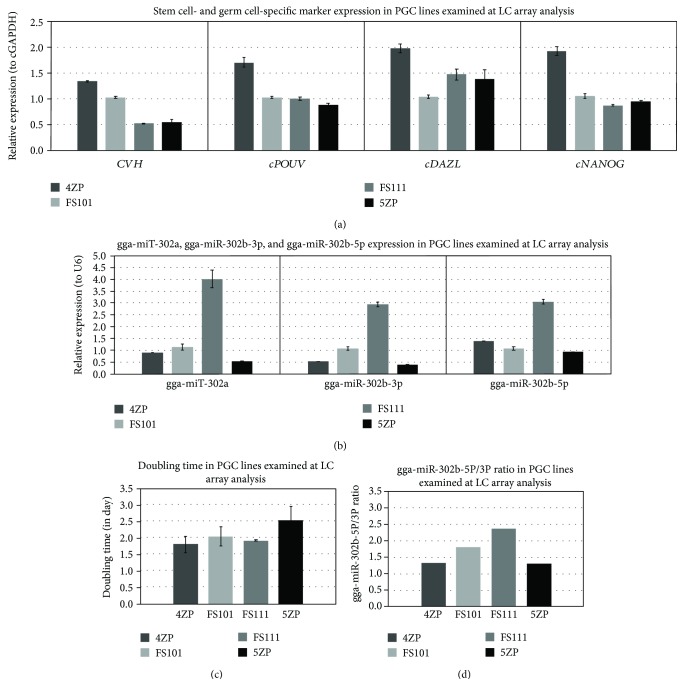
Figure 10.
Expression pattern of stem cell- and germ cell-specific markers in RNA samples examined at LC miRNA microarray analysis. We performed qPCR analysis to check the RNA expression profile in samples sent to LC microarray analysis. We compared one female (5ZP) and one male (4ZP) GFP PGC sample, and one female (FS111) and one male (FS101) PC PGC sample using 3 parallel samples at qPCR analysis. (a), (b) Expression of CVH, cDAZL, cPOUV, and cNANOG (relative to cGAPDH as the reference gene) and gga-miR-302a, gga-miR-302b-3p, and gga-miR-302b-5p (relative to U6 as the reference gene) was analysed. Relative gene expression values were calculated relative to the FS101 sample in each case. (c) The proliferation rate of PGCs was measured on 3 different days using CCK-8 proliferation assay. The doubling time was calculated according to the measured optical densities (OD). (d) The miR-302b-5p/miR-302b-3p ratio was calculated from the average delta Ct values of samples.

