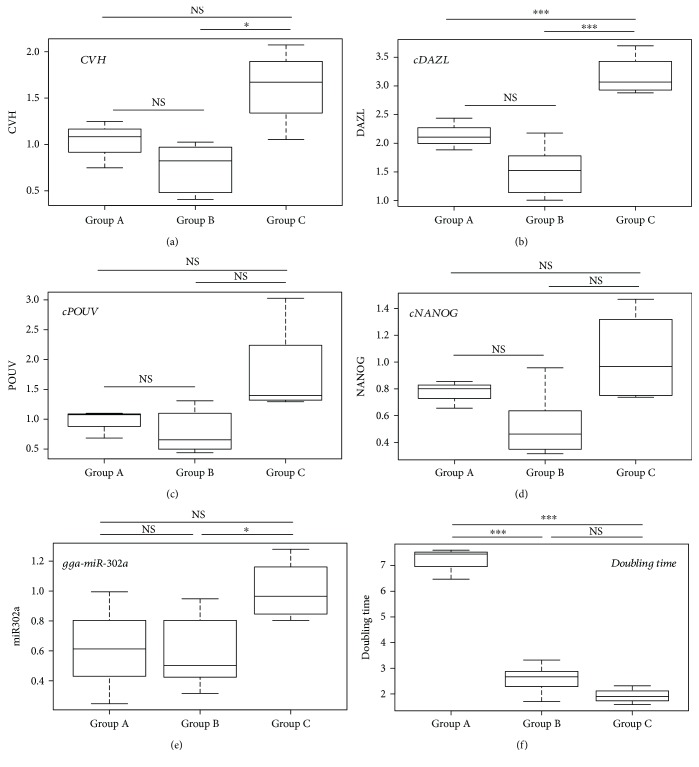
Figure 6.
Stem cell- and germ cell-specific marker expression and the doubling time of PGCs. Expression of the germ and stem cell-specific markers in the three groups was identified by clustering analysis. The box plots represent descriptive statistical parameters (minimum, maximum, median, and first and third quartiles) which were calculated from the expression datasets for each marker. Differences among the groups identified by the hierarchical clustering were tested. Welch's t-tests were performed between the groups in case of each variable. Expression of the germ cell-specific markers CVH and cDAZL is shown in (a) and (b), and expression of the stem cell-specific markers cPOUV, cNANOG, and gga-miR302a is shown in (c), (d) and (e), respectively. In (f), the proliferation rate is indicated, measured as doubling time of the PGC lines. Evaluation of the p values: ∗∗∗ p < 0.001 and ∗ p < 0.05. NS: nonsignificant.

