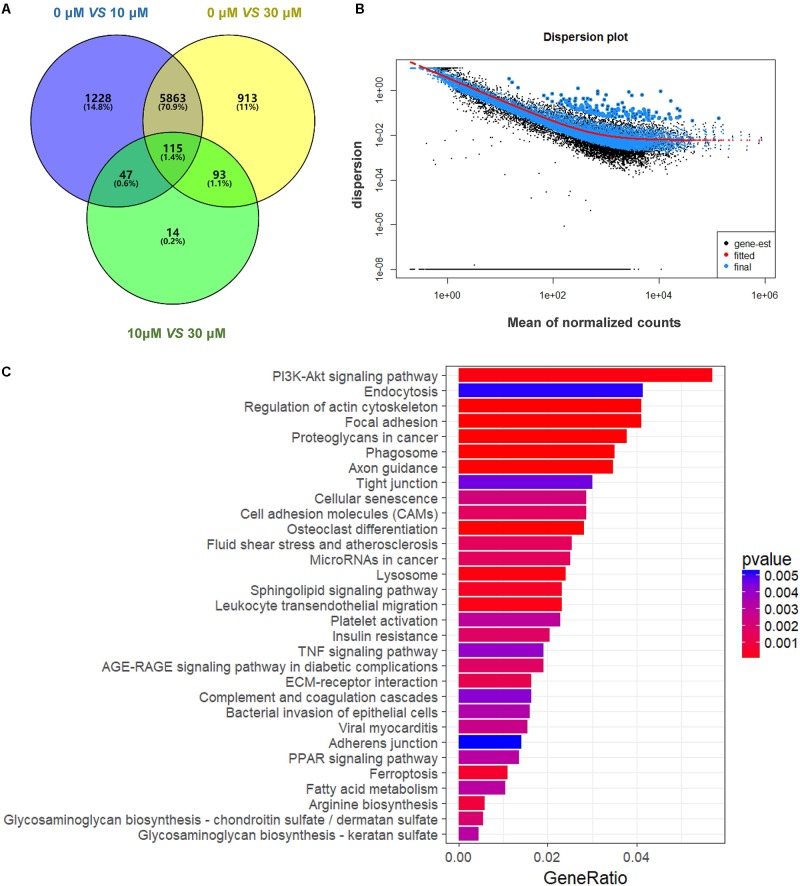
FIGURE 3.
Gene expression of RNA-seq analysis in granulosa cells between control and ZEA-treated groups. (A) Venn diagram showed that the different expression of 14,506 genes in control and ZEA-treated groups. (B) Dispersion plot. The dispersion estimate plot shows the gene-wise estimates (black), the fitted values (red), and the final maximum a posteriori estimates used in testing (blue). (C) KEGG biological processes involving DEGs in ZEA-treatment GCs.

