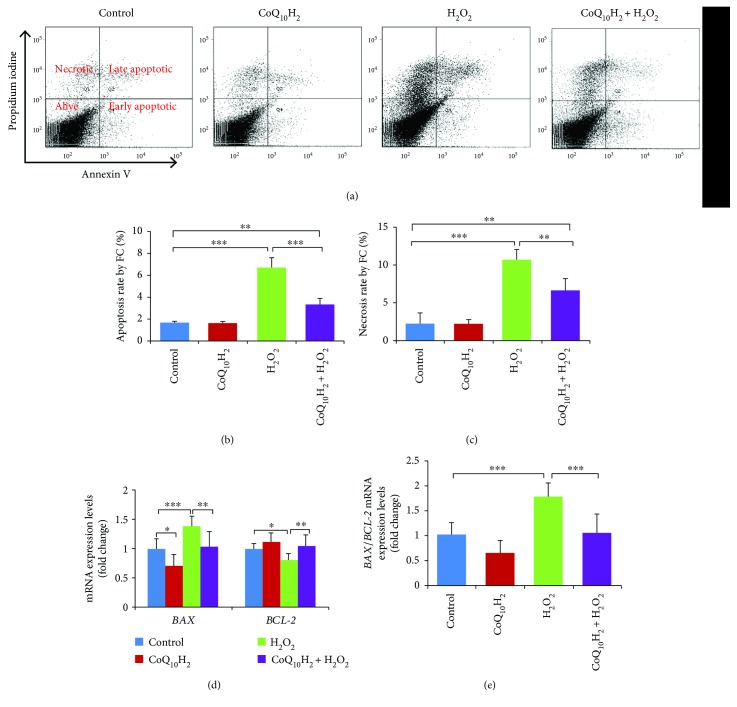
Figure 3.
Preincubation with CoQ10H2 protects HUVECs from H2O2-induced apoptosis and necrosis. (a) Apoptotic cells were stained with annexin V-FITC and PI and evaluated by flow cytometry. Representative graphs of flow cytometric outputs for each group are shown. (b and c) Bar diagram representing apoptotic and necrotic cell populations (n = 6). (d) Analysis of BAX and BCL-2 gene expression. Histograms show fold change in mRNA level relative to control cells (n = 9). (e) Histograms show BAX/BCL-2 ratio (n = 9). ∗ P < 0.05, ∗∗ P < 0.01, and ∗∗∗ P < 0.001; one-way ANOVA followed by Tukey's test.

