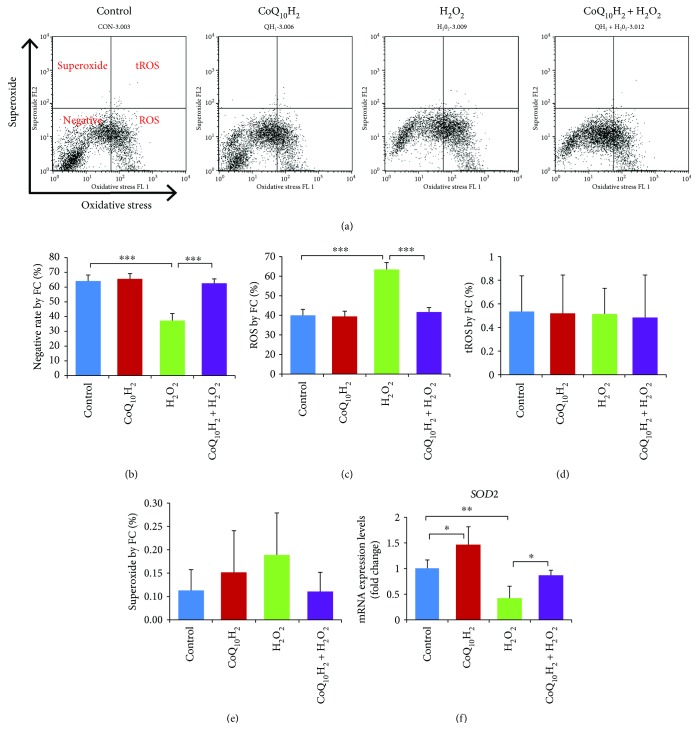
Figure 4.
Preincubation with CoQ10H2 decreased H2O2-induced ROS production in HUVECS. (a) Cells were stained with two color oxidative stress detection reagents for determining ROS production and superoxide levels. Representative pictures of flow cytometry output show the cell population in the four fractions separated by ROS and superoxide (n = 6). (b, c, d, and e) Histograms show percentage of cells in negative fractionation, ROS-positive fraction, double-positive fraction, and superoxide-positive fraction. (f) Real-time RT-PCR analysis of SOD2 mRNA expression in cells. Histograms show fold change in mRNA level relative to control cells (n = 6). ∗ P < 0.05, ∗∗ P < 0.01, and ∗∗∗ P < 0.001; one-way ANOVA followed by Tukey's test.

