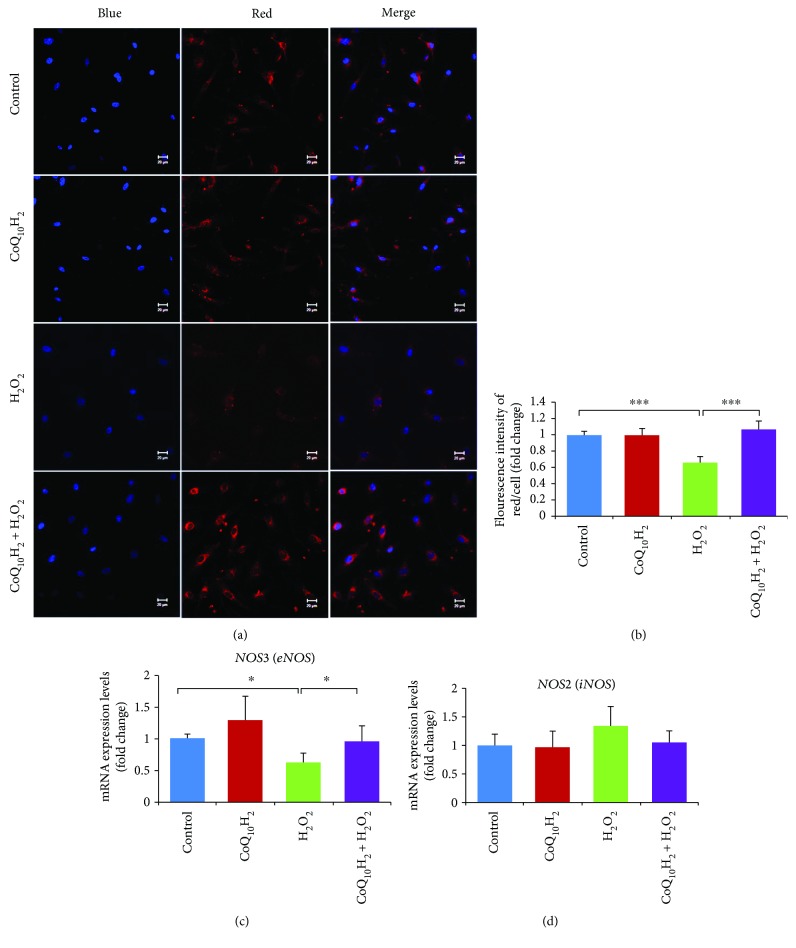
Figure 5.
Preincubation with CoQ10H2 prevents H2O2-induced suppression of NO production in HUVECs. (a) Representative images of staining with DAPI (blue) and a NO-specific fluorometric probe (red) acquired using a laser scanning microscope. The two images in each row were captured within the same field and then merged. (b) The intracellular NO level was calculated from the fluorescence intensity in each cell. Histograms show fold change in NO levels relative to control cells (n = 6). (c and d) Analysis of eNOS and iNOS gene expression. Histograms show fold change in mRNA level relative to control cells (n = 10). ∗ P < 0.05 and ∗∗∗ P < 0.001; one-way ANOVA followed by Tukey's test.

