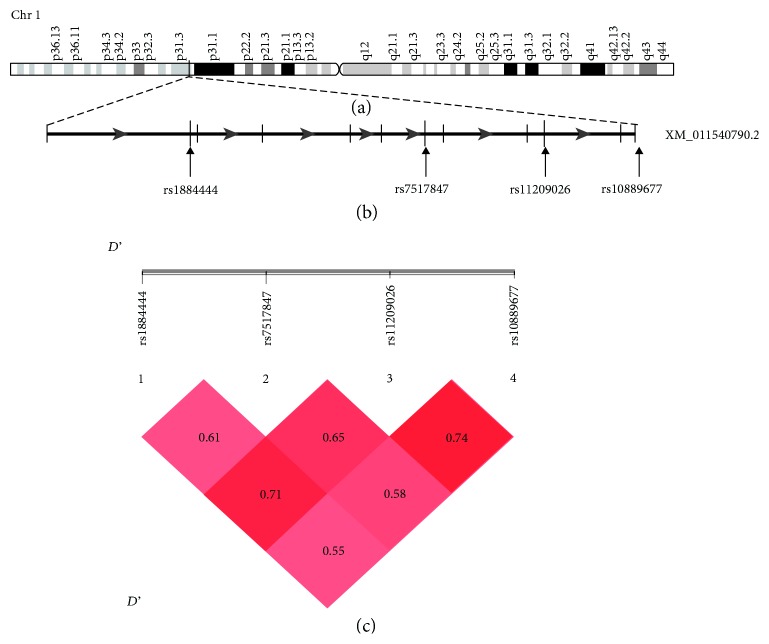
Figure 1.
Overview and linkage disequilibrium (LD) on chromosome 1q31.1. (a) Overview of chromosome 1. (b) Schematic structure of the IL23R gene. Exons are depicted by black vertical lines. The positions of the four SNPs are shown by the arrows. (c) LD prime charts generated using SHEsis software summarize LD (D') patterns between the 4 SNP. D' > 0.7 is considered as a high value of LD.

