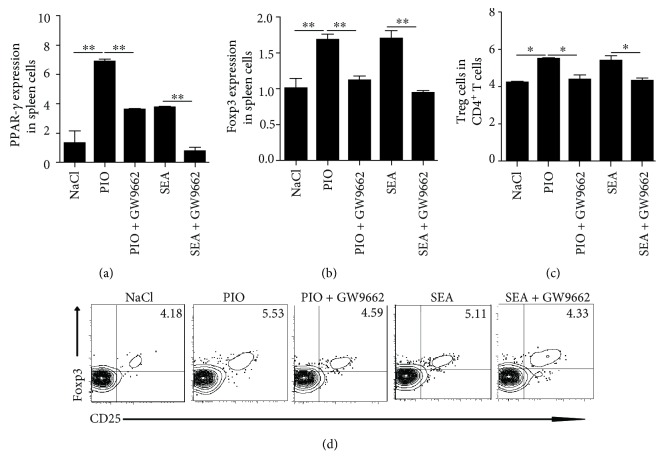
Figure 3.
The expression of Foxp3 and Treg cells after pioglitazone or (and) SEA stimulation in vitro. (a, b) Splenocytes from WT mice were prepared and stimulated by pioglitazone (PIO, 10 μg/ml) and a PPAR-γ antagonist (GW9662, 2 ng/ml) with or without SEA (25 μg/ml) stimulation for 24 h, and then the mRNA level of PPAR-γ and Foxp3 were analyzed by RT-PCR. (c, d) The percentage of Treg was detected after pioglitazone treatment in spleen cells with or without SEA stimulation for 24 h. All experiments were repeated three times with similar results (ANOVA/LSD). ∗P < 0.05 and ∗∗P < 0.01.

