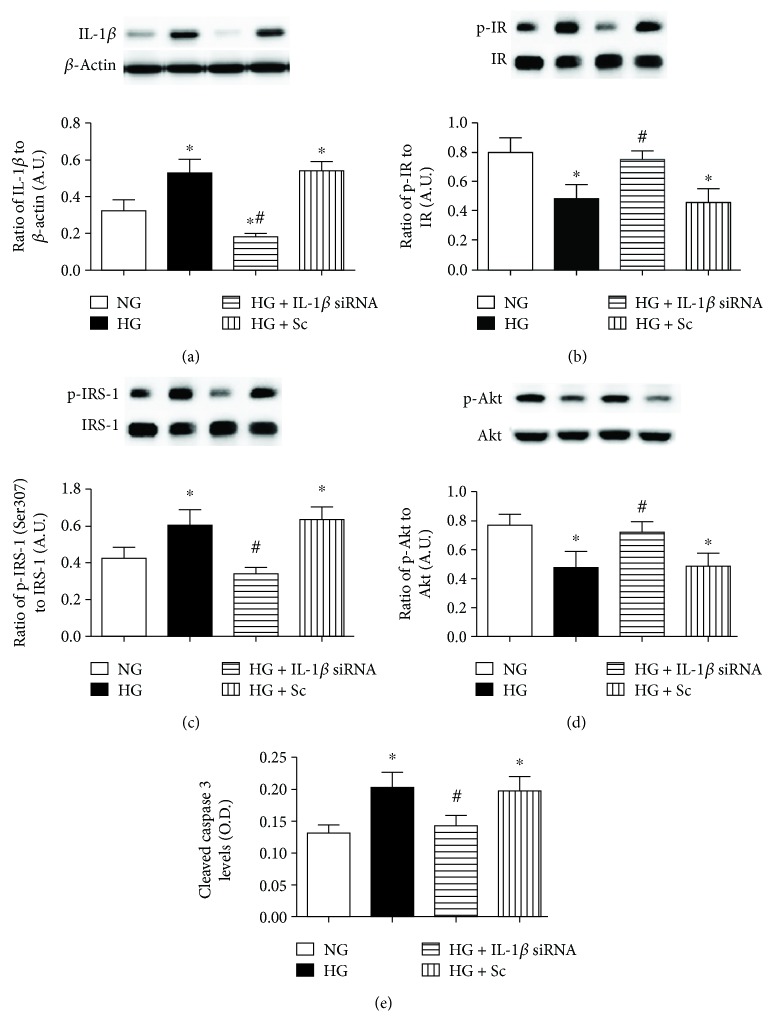
Figure 5.
(a) Western blotting for the ratio of IL-1β siRNA to β-actin in REC grown in normal glucose (NG) and high glucose (HG). Some REC grown in HG were transfected with IL-1β siRNA or scrambled siRNA (sc). (b–d) Western blotting for the ratio of phosphorylated insulin receptor on tyrosine 1150/1151 (p-IR), IRS-1Ser307 (p-IRS-1), and Akt (p-Akt) to total protein. (e) ELISA results for cleaved caspase 3 levels. ∗P < 0.05 versus NG, #P < 0.05 versus HG. N = 4 or 5 for all groups. Data are mean ± SEM.

