Figure 3.

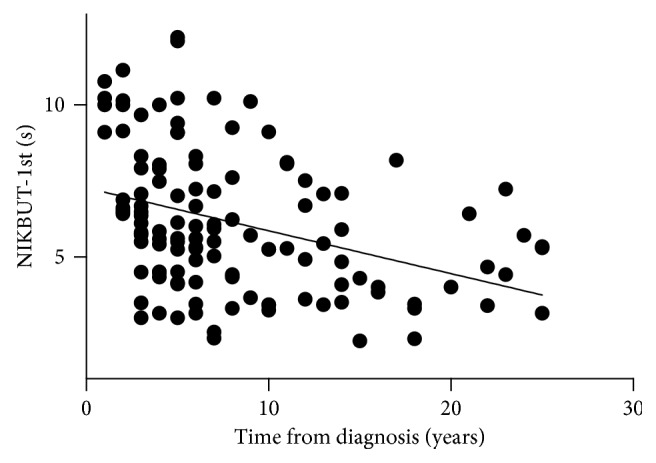
Scatterplot graph showing a slight negative Spearman correlation (rs=−0.41 and P < 0.0001) between NIKBUT-1st and time from diagnosis.

Scatterplot graph showing a slight negative Spearman correlation (rs=−0.41 and P < 0.0001) between NIKBUT-1st and time from diagnosis.