-
A
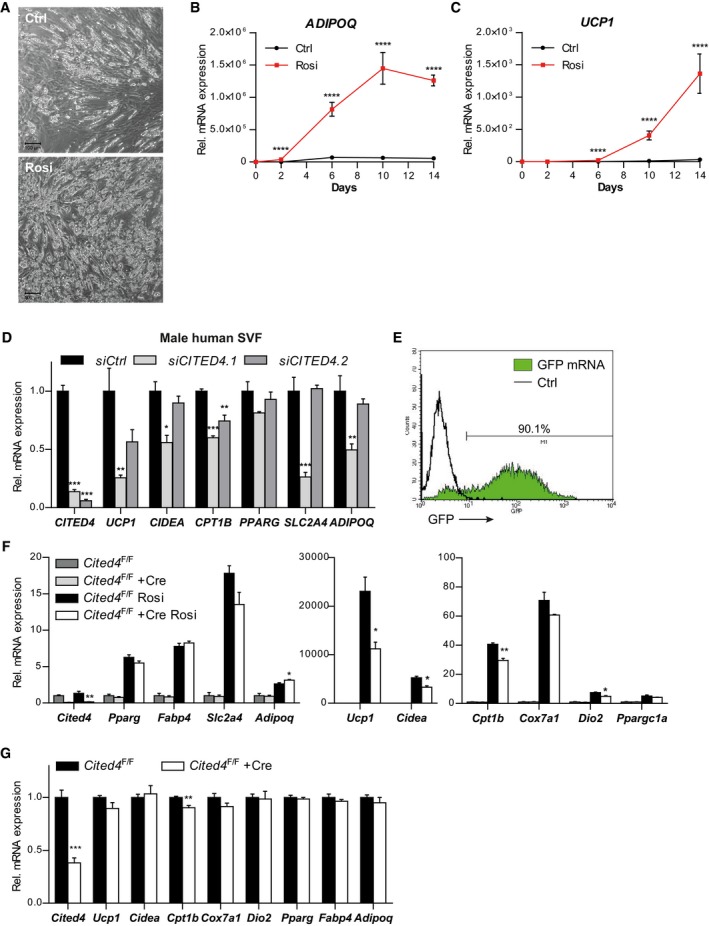
Phase contrast microscopy of primary SVF cells from human subcutaneous fat, differentiated in the presence of 100 nM Rosi or vehicle for 14 days (representative of n = 5 patients). Scale bar is 100 μm.
-
B, C
mRNA expression in primary SVF cells from human subcutaneous fat, differentiated in the presence of 100 nM Rosi or vehicle, as determined by qRT–PCR (n = 5 patients). (B) ****P = 1 × 10⁻¹⁰ (Day 2), ****P = 5 × 10⁻⁸ (Day 6), ****P = 1 × 10⁻⁹ (Days 10 and 14), (C) ****P = 7 × 10⁻⁷ (Day 6), ****P = 1 × 10⁻⁹ (Days 10 and 14) in 2 × 2 ANOVA with Bonferroni's posttests (Rosi vs. vehicle).
-
D
mRNA expression in primary SVF cells from human male subcutaneous fat transfected with the indicated siRNA prior to differentiation in the presence of 100 nM Rosi for 9 days, as determined by qRT–PCR (n = 3). ***P = 0.0002 (siCITED4.1 CITED4), ***P = 0.0003 (siCITED4.2 CITED4), **P = 0.005 (UCP1), *P = 0.01 (CIDEA), ***P = 0.0006 (CITED4.1 CPT1B), **P = 0.007 (CPT1B), ***P = 0.0006 (CITED4.1 SLC2A4),**P = 0.009 (ADIPOQ) in ANOVA with Tukey's posttests (vs. siCtrl).
-
E
GFP fluorescence intensity distribution of Lin−Sca1+ progenitor cells 24 hours after transfection with GFP mRNA, determined by flow cytometry (compared to non‐transfected cells).
-
F
mRNA expression in female Cited4
F/F Lin−Sca1+ progenitor cells transfected with Cre or control mRNA prior to differentiation in the presence of 100 nM Rosi or vehicle for 8 days, as determined by qRT–PCR (n = 3). t‐test Cre vs. Ctrl (Rosi), **P = 0.002 (Cited4), *P = 0.039 (Adipoq), *P = 0.015 (Ucp1), *P = 0.011 (Cidea), **P = 0.004 (Cpt1b), *P = 0.011 (Dio2).
-
G
mRNA expression in female Cited4
F/F Lin−Sca1+ progenitor cells transfected with Cre or control mRNA 3 days after induction of differentiation in the presence of 100 nM Rosi or vehicle for 8 days, as determined by qRT–PCR (n = 4). t‐test Cre vs. Ctrl, ***P = 0.0005 (Cited4), **P = 0.009 (Cpt1b).
Data information: Data are presented as mean ± SEM except for (E) (individual data).

