-
A
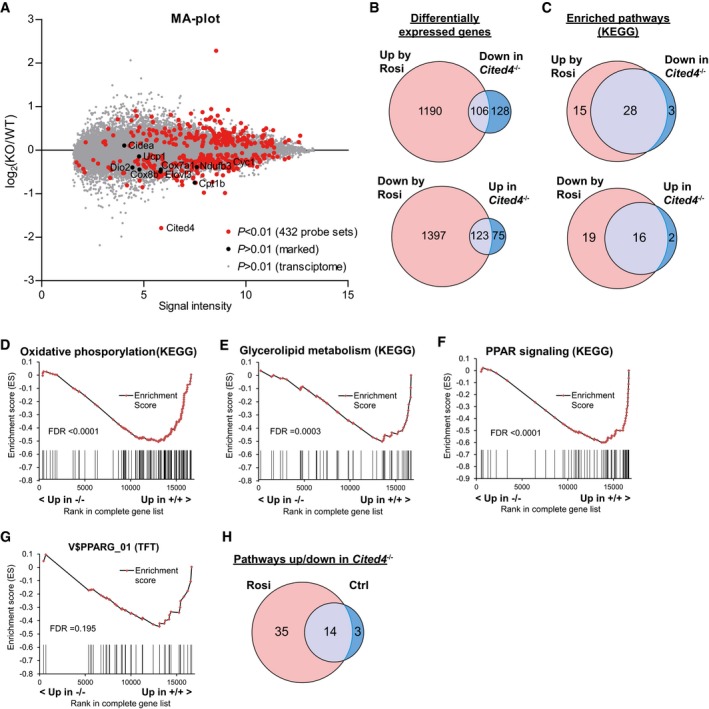
MA‐plot of RNA expression profiles from female Lin−Sca1+ progenitors 2 days after induction of differentiation with 100 nM Rosi, displaying the log2‐ratio of Cited4
−/− to Cited4
+/+ intensities against the average log2‐intensities for all microarray probe sets (n = 3). t‐test with Welch's correction on Cited4
−/− vs. Cited4
+/+ (Rosi).
-
B
Comparison of the lists of genes significantly changed by Rosi in wild‐type cells (Cited4
+/+: Rosi vs. Ctrl, P < 0.01) or by Cited4‐knockout under Rosi treatment (Rosi: Cited4
−/− vs. Cited4
+/+, P < 0.01) in expression profiles from female Lin−Sca1+ progenitors 2 days after induction of differentiation with 100 nM Rosi or vehicle (n = 3, t‐test with Welch's correction).
-
C
Comparison of the lists of gene sets significantly enriched by Rosi in wild‐type cells (Cited4
+/+: Rosi vs. Ctrl, false discovery rate (FDR) <0.1) or by Cited4‐knockout under Rosi treatment (Rosi: Cited4
−/− vs. Cited4
+/+, FDR < 0.1) in GSEA (KEGG) (n = 3).
-
D–G
Enrichment plots from GSEA with the KEGG (D–F) or TFT (G) gene set collection (Cited4
−/− vs. Cited4
+/+), performed on RNA expression profiles 2 days after induction of differentiation with 100 nM Rosi (n = 3). Vertical bars represent the individual genes of the gene set.
-
H
Comparison of the lists of gene sets affected by Cited4‐knockout under Rosi or under vehicle treatment (Cited4
−/− vs. Cited4
+/+, FDR < 0.1) in GSEA as in (C).
Data information: Data points in (A) and vertical bars (D–G) represent means for individual genes.

