-
A
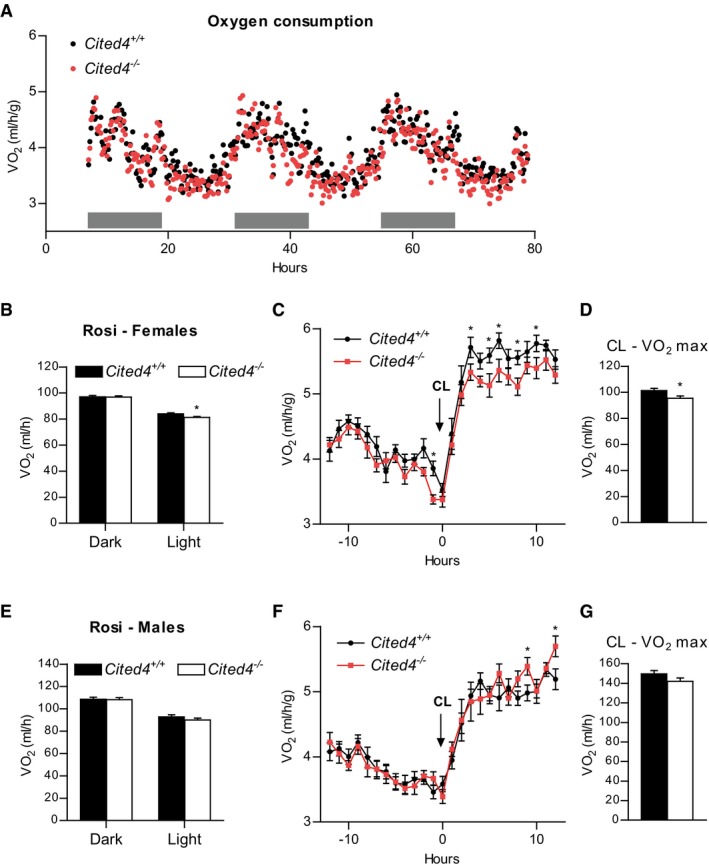
Oxygen consumption rate of female mice fed a diet with 0.0075% Rosi for 2.5 weeks, determined by indirect calorimetry and normalized to body weight (n = 9/10). Gray bars represent the dark phase.
-
B
Oxygen consumption rate of female mice shown in (A) adjusted for body weight by ANCOVA. Three‐day averages of VO2 were calculated for each mouse (n = 9/10). *P = 0.025 in ANCOVA with Bonferroni's posttest (Cited4
−/− vs. Cited4
+/+).
-
C
Oxygen consumption rate of female mice fed a diet with 0.0075% Rosi for 3.5 weeks and injected with 1 mg/kg CL‐316,243 (CL) at the indicated time point, as determined by indirect calorimetry (n = 9/10). *P = 0.013 (−1 h), *P = 0.045 (3 h), *P = 0.015 (5 h), *P = 0.016 (6 h), *P = 0.019 (8 h), *P = 0.046 (10 h) in repeated‐measures 2 × 2 ANOVA with Holm–Sidak posttests (Cited4
−/− vs. Cited4
+/+).
-
D
Maximal CL‐induced oxygen consumption rate of female mice shown in (C) adjusted for body weight by ANCOVA. Averages of VO2 throughout 3–8 h post‐CL injection were calculated for each mouse (n = 9/10). *P = 0.049 in ANCOVA with Bonferroni's posttest (Cited4
−/− vs. Cited4
+/+).
-
E
Oxygen consumption rate of male mice treated as in (A), determined as in (C) (n = 9/10). ANCOVA with Bonferroni's posttest (Cited4
−/− vs. Cited4
+/+).
-
F
Oxygen consumption rate of male mice treated as in (C), determined as in (C) (n = 9/10). *P = 0.044 (9 h), *P = 0.013 (12 h) in repeated‐measures 2 × 2 ANOVA with Holm–Sidak posttests (Cited4
−/− vs. Cited4
+/+).
-
G
Maximal CL‐induced oxygen consumption rate of male mice shown in (F) and calculated as in (D) (n = 9/10). ANCOVA with Bonferroni's posttest (Cited4
−/− vs. Cited4
+/+).
Data information: Data presented as mean ± SEM.

