-
A
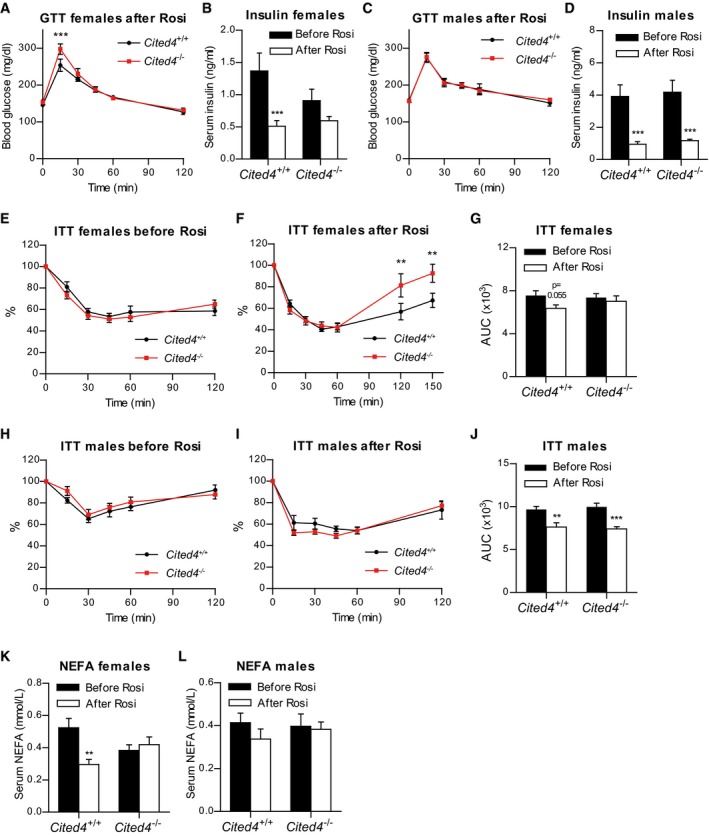
Blood glucose during glucose tolerance test (GTT) on female mice after 11 weeks of HFD and 3 weeks of HFD + Rosi (n = 8). ***P = 0.001, in repeated‐measures 2 × 2 ANOVA with Holm–Sidak posttests (Cited4
−/− vs. Cited4
+/+).
-
B
Fasting serum insulin in female mice after 10 weeks of HFD (“Before Rosi”) or 11 weeks of HFD and 2.5 weeks of HFD+Rosi (“After Rosi”) (n = 8). ***P = 0.0009 in repeated‐measures 2 × 2 ANOVA with Holm–Sidak posttests (After Rosi vs. Before Rosi); P = 0.725 (Cited4
−/− vs. Cited4
+/+ Before Rosi).
-
C
Blood glucose during GTT on male mice as in (A) (n = 5/8). Repeated‐measures 2 × 2 ANOVA with Holm–Sidak posttests (Cited4
−/− vs. Cited4
+/+).
-
D
Fasting serum insulin in male mice as in (C) (n = 7/7/8/8). ***P = 0.001 (Cited4
+/+), ***P = 0.0008 (Cited4
−/−) in repeated‐measures 2 × 2 ANOVA with Holm–Sidak posttests (After Rosi vs. Before Rosi).
-
E, F
Blood glucose during insulin tolerance test (ITT) with 1 U insulin per kg body mass on female mice after 12 weeks of HFD (n = 8) (E) or 16 weeks of HFD and 4 weeks of HFD + Rosi (n = 7) (F), expressed as % of the 0‐time point value. **P = 0.003 in repeated‐measures 2 × 2 ANOVA with Holm–Sidak posttests (Cited4
−/− vs. Cited4
+/+).
-
G
Area under the curve (AUC) of blood glucose during the ITT (0‐120 min) in (E,F). 2 × 2 ANOVA with Holm–Sidak posttests (After Rosi vs. Before Rosi).
-
H, I
Blood glucose during insulin tolerance test (ITT) on male mice as in (E, F), n = 8 (H), n = 7/8 (I). Repeated‐measures 2 × 2 ANOVA with Holm–Sidak posttests (Cited4
−/− vs. Cited4
+/+).
-
J
Area under the curve (AUC) of blood glucose during the ITT in (H, J). **P = 0.001, ***P = 0.00006 in 2 × 2 ANOVA with Holm–Sidak posttests (After Rosi vs. Before Rosi).
-
K, L
Fasting serum non‐esterified fatty acids (NEFA) in female (K) or male (L) mice after 10 weeks of HFD (“Before Rosi”) or 11 weeks of HFD and 2.5 weeks of HFD + Rosi (“After Rosi”), n = 7/8/8/8 (K), n = 6/6/6/8 (L). **P = 0.001 in 2 × 2 ANOVA with Holm–Sidak posttests (After Rosi vs. Before Rosi).
Data information: Data presented as mean ± SEM.

