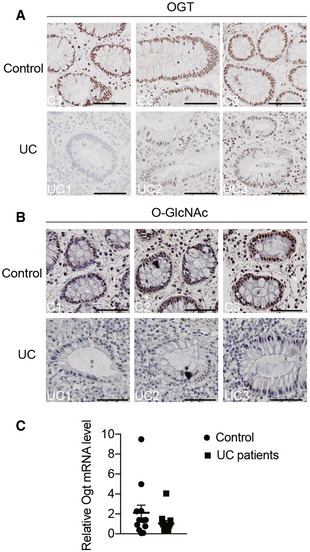
Figure EV1. Defective O‐GlcNAc signaling in epithelial cells of Chinese UC patients.

-
A, BRepresentative images of OGT (A) and O‐GlcNAc (B) immunohistochemistry in colon tissues from Chinese normal controls and UC subjects. Scale bars = 50 μm.
-
CmRNA levels of OGT in the colon from Chinese healthy and UC subjects (n = 12).
