-
A
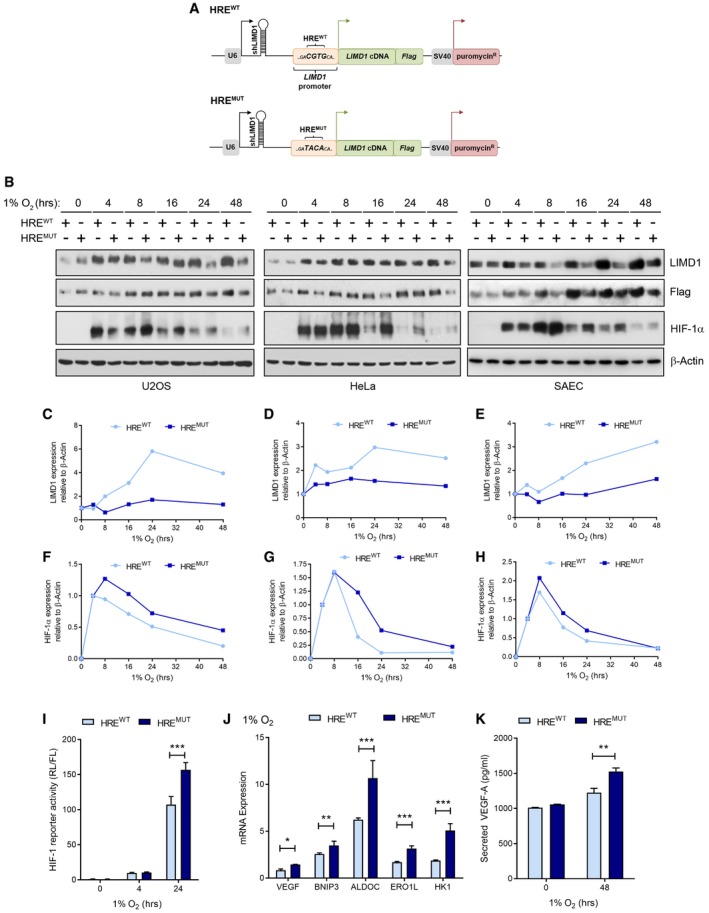
A combinatorial RNAi–cDNA re‐expression lentiviral cassette was utilised to create isogenic cell lines where LIMD1 was either responsive or unresponsive to hypoxia. Endogenous LIMD1 was depleted by shRNA, whilst concurrently a Flag‐LIMD1 cDNA was expressed that was driven by the sequence of its own endogenous promoter.
-
B
U2OS, HeLa and SAEC were transduced with these lentiviral cassettes to create the HREwt and HREmut paired cell lines.
-
C–E
Western blot quantification of LIMD1 relative to β‐actin and normalised to 0‐h time‐point for each cell line.
-
F–H
Western blot quantification of HIF‐1α relative to β‐actin and normalised to 4‐h time‐point for each cell line.
-
I
Impaired hypoxic induction of LIMD1 induction increases HRE‐luciferase activity. U2OS isogenic cell lines were co‐transfected with a synthetic HRE‐luciferase (pNL‐HRE) and pGL3 firefly normalisation plasmid, prior to exposure to hypoxia. Luciferase activity was assayed and normalised against HRE activity in the HREwt line. After 24‐h hypoxic exposure, the HREmut line had significantly increased luciferase activity compared to the HREwt line.
-
J
Impaired hypoxic induction of LIMD1 induction increases expression of HIF target genes. RNA was extracted from the U2OS isogenic cell lines following 24‐h hypoxic exposure, and a panel of HIF‐1 downstream targets were quantified by qRT–PCR. The HREmut line had significantly increased HIF‐1‐driven gene expressions compared to the HREwt line.
-
K
Impaired hypoxic induction of LIMD1 induction increases VEGF‐A secretion. U2OS isogenic cell lines were incubated in hypoxia for 48 h and VEGF‐A secretion was quantified by ELISA, identifying the HREmut line as secreting a significantly increased VEGF‐A protein when compared to the HREwt line.
Data information: Unless otherwise stated, data shown are mean ± SEM,
n = 3, *
P < 0.05, **
P < 0.01, ***
P < 0.001, according to Holm–Šidák
post hoc tests, comparing genotypes at each time‐point (I and K) or at each gene (J), following significant main effects/interactions of a mixed‐model ANOVA. See
Appendix Table S3 for a summary of statistical analysis.
Source data are available online for this figure.

