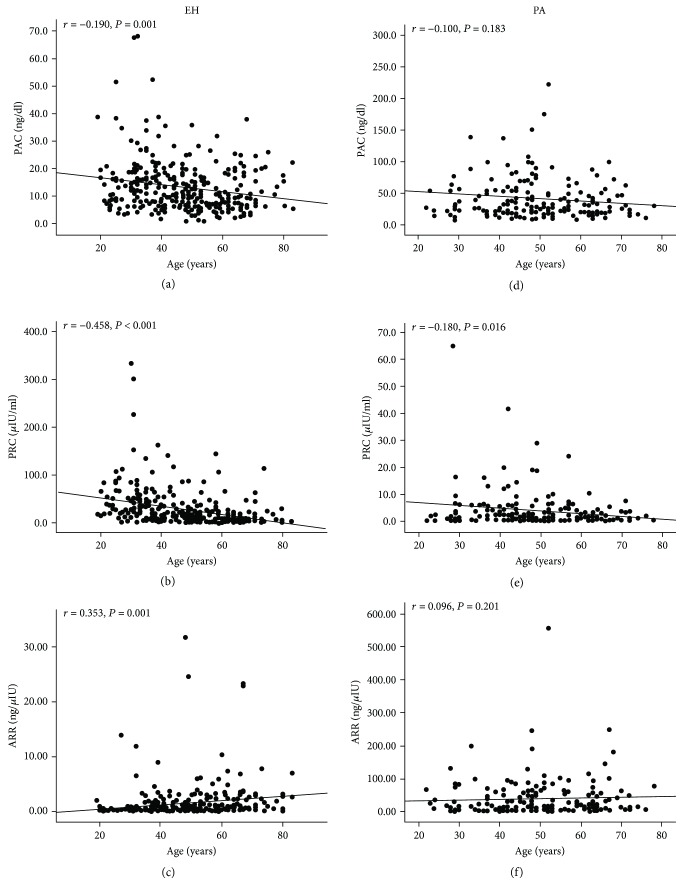
Figure 2.
Scatter plots showing the correlation of PRC, PAC, and ARR levels with age in patients with EH and PA. The PAC (a) and PRC (b) were negatively correlated with age whereas ARR (c) was positively correlated with age in patients with EH. In the PA group, PRC was negatively correlated with age but neither PAC nor ARR was significantly associated with age (d–f).

