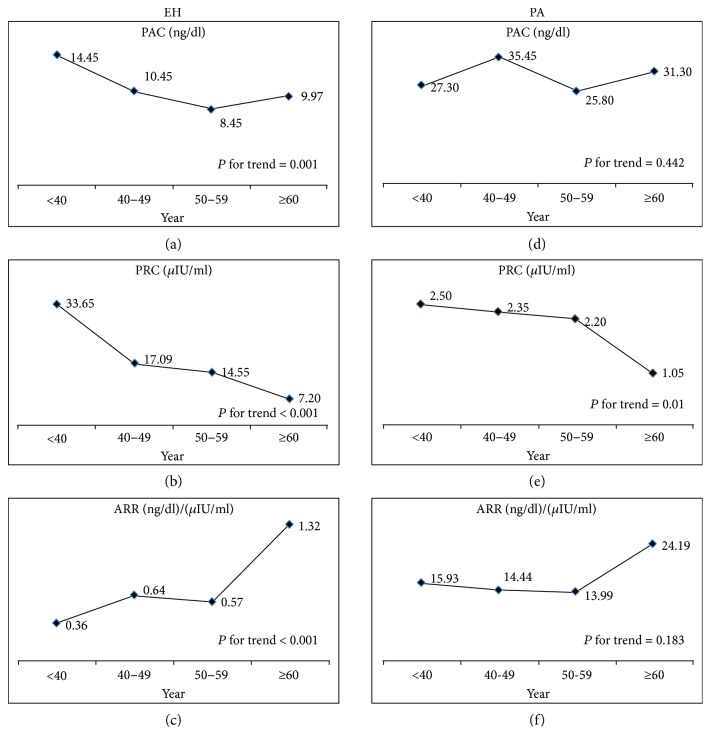
Figure 3.
Line chart of PAC, PRC, and ARR in different age groups in patients with EH and PA. In the EH group, PRA lowered more than PAC and led to higher ARR with increasing age. In the PA group, PRA significantly declined with increasing age, but the trends for PAC and ARR were not significant. ARR: aldosterone to renin ratio; PA: primary aldosteronism; PAC: plasma aldosterone concentration; PRC: plasma renin concentration.

