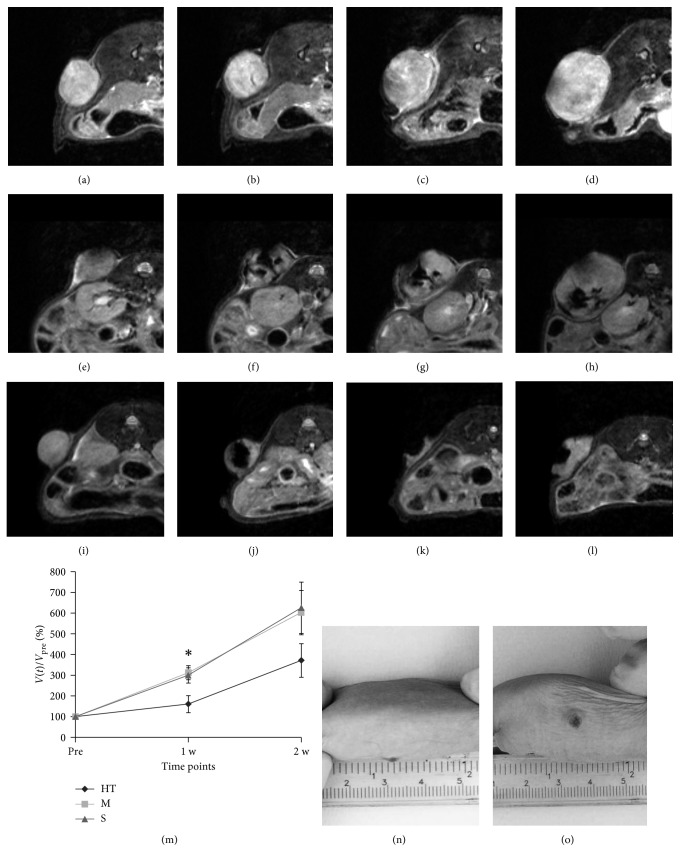
Figure 4.
MR images of representative animals. (a–d) Animal treated with saline injection; images acquired before saline injection (a), 24 h (b), one week (c), and two weeks (d) after saline injection. (e–h) Animal treated with MNs injection; images acquired before MNs injection (e), 24 h (f), one week (g), and two weeks (h) after MNs injection. (i–l) Animal treated with MNs injection with AMF; images acquired before MNs injection (i), 24 h (j), one week (k), and two weeks (l) after MNs injection. (m) shows the relative tumor size for the three experimental groups as a function of time (∗ p < 0.05). (n) and (o) show two pictures of a representative animal treated with AMF and MNs in which we obtained good response to thermotherapy.

