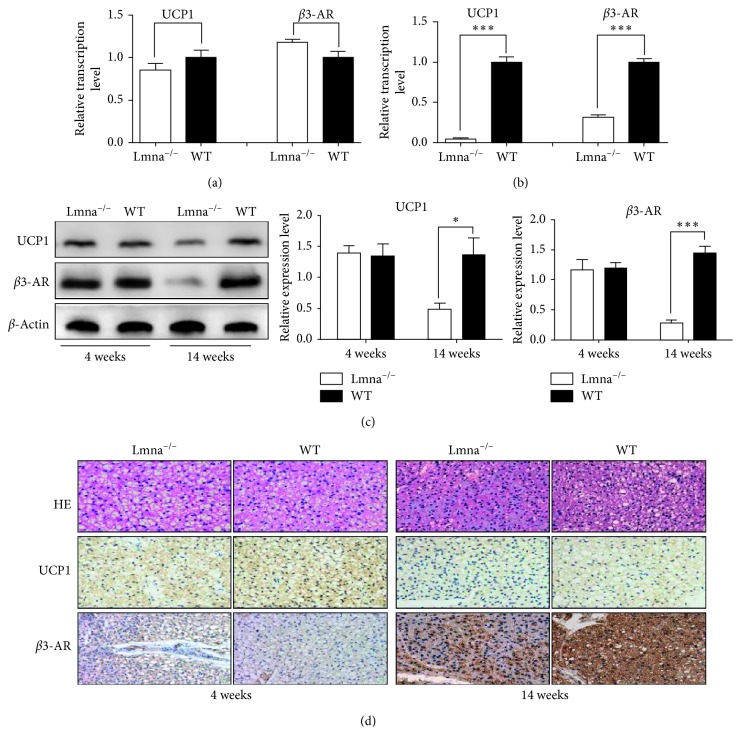
Figure 2.
Analysis of beta3-AR and UCP1 levels in the BAT of Lmna−/− and WT mice. (a, b) Relative transcription levels of UCP1 and β3-AR in Lmna−/− and WT mice at 4 and 14 weeks of age. (c) Western blot analysis for UCP1, beta3-AR, and β-actin and semiquantitative analysis of the expression levels of UCP1 and β3-AR. (d) BAT hematoxylin and eosin staining and immunohistochemical analysis of beta3-AR and UCP1. ∗ P < 0.05; ∗∗ P < 0.001; ∗∗∗ P < 0.001.

