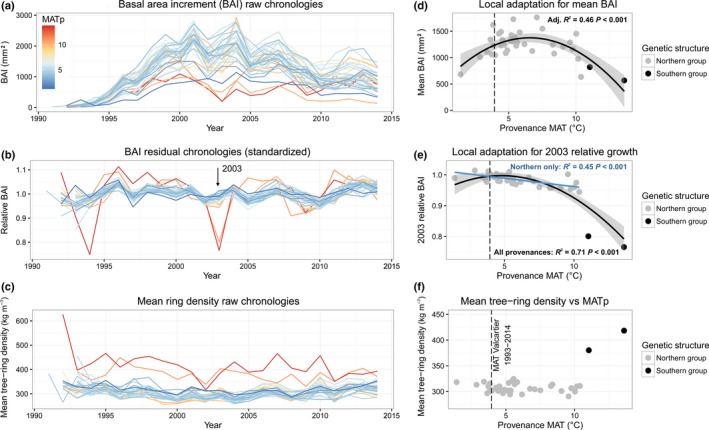
Figure 3.

Tree‐ring phenotypes. (a) Annual raw–absolute basal area increment (BAI), (b) annual standardized residual BAI scores and (c) annual raw‐absolute tree‐ring density averaged by populations. The color gradient represents the mean annual temperature of the provenance (MAT p, °C) (red, warmer; blue, colder). The following relationships between MAT p and tree‐ring phenotypes of the populations are illustrated: (d) BAI averaged over 1993–2014, (e) relative growth variation in 2003 (BAI 2003) and (f) tree‐ring density averaged over 1993–2014. The genetic structure groups described by Nadeau et al. (2015) are represented by gray (northern group) and black (southern group) points. Significant relationships among all provenances suggesting local adaptation are represented by black lines. Significant relationships for the subset of provenances from the northern genetic structure group are represented by a blue line. The relationships were chosen according to a model selection procedure (Akaike information criterion, see the Materials and Methods section) between a linear model and a second‐order polynomial regression model. Only significant models are shown.
