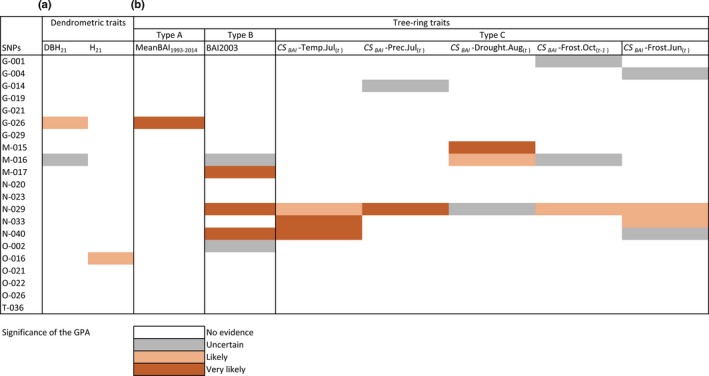
Figure 6.

Tests of genotype–phenotype associations (GPAs) between traits and candidate loci from a previous genotype–environment association (GEA) analysis (Nadeau et al., 2016): (a) dendrometric traits (DBH 21 and H21 = diameter at breast height and height at 21 yr), and (b) tree‐ring traits of types A, B and C. For each SNP–trait pair, the association was tested with different levels of corrections: without correction, with correction for the genetic structure (Q), and with correction for both genetic structure and kinship (Q + K). The significance of the associations was classified as very likely (when significant for three levels of correction), likely (when significant for two levels) or uncertain (when significant for only one level of correction). BAI, basal area increment; CS, climate sensitivity trait; Temp, temperature; Prec, precipitation; Drought, drought code; Freeze, number of freezing days during the month.
