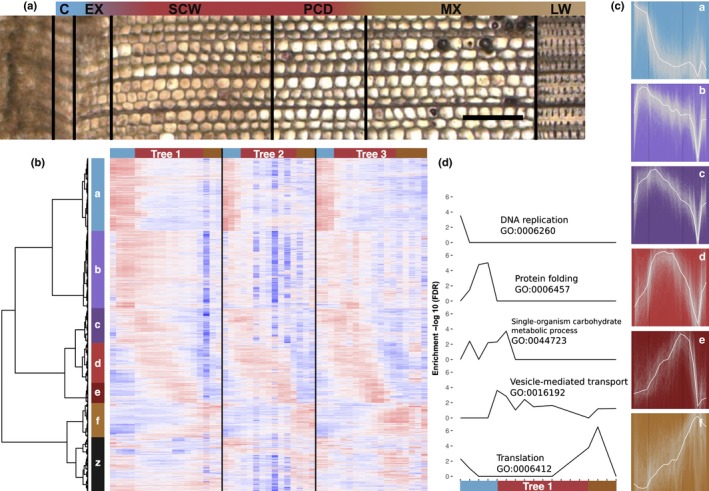
Figure 1.

Clustering of Picea abies gene expression profiles matching developmental transitions. (a) A representative transverse section stained with nitroblue tetrazolium (NBT) from the stem of Tree 1. A high‐spatial‐resolution gene expression atlas was created by collecting series of tangential cryosections from the stem. The sections were pooled into 14–18 pools in each tree in such a way that representative samples were obtained for each stage of xylem development including cambium (C), xylem expansion (EX), secondary cell wall formation (SCW), programmed cell death (PCD), mature xylem (MX) and the previous year′s latewood formation (LW). Bar, 200 μm. (b) Hierarchical clustering of gene expression data in cryosection series of three trees. Seven gene expression clusters are indicated (a–f, z). Cluster‐z contained genes with no defined profile across the cutting series and was not further analysed. Samples appear in the order of sampling within each tree (T1–T3) and three sample clusters are indicated (blue, red and brown). Expression values are scaled per gene so that expression values above the gene average are represented by red, and below average by blue. (c) Expression profiles of genes within six of the gene clusters. The average expression of each gene cluster is shown in white with all expression profiles from Tree 1 plotted in grey in the background. (d) Genes were assigned to the sample(s) within Tree 1 in which they were expressed within 4% of the maximum expression for that gene, after which gene ontology (GO) enrichment was calculated for each sample. Selected GO categories are represented. All significant categories are available in Supporting Information Table S5.
