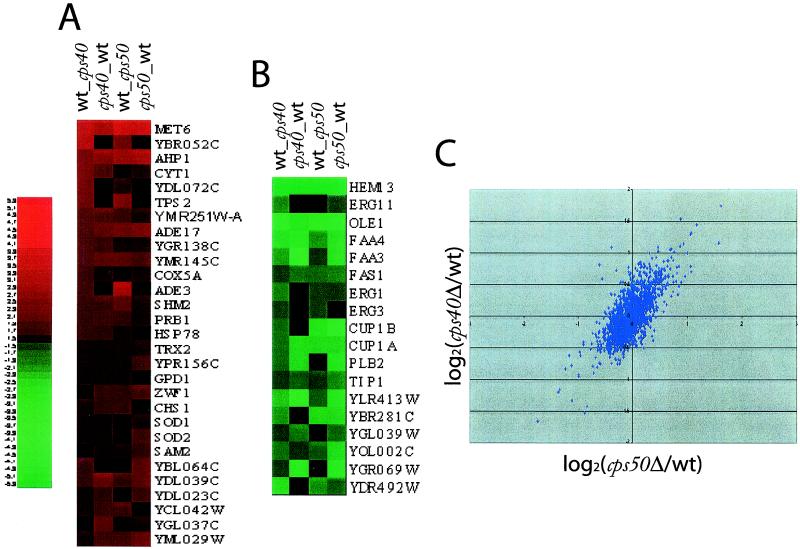
Figure 4.
The effects of cps50 and cps40 deletions on gene expression are similar. (A) Genes whose mRNA levels are down-regulated [cps50 (003) and cps40 (138)] at least 1.5-fold in both COMPASS deletion strains. The black box indicates that the effect of gene expression for that point is less than 1.5-fold. (B) Genes whose mRNA levels are up-regulated at least 1.5-fold in both COMPASS deletion strains. In each case (e.g., cpsΔ_wt), the first name listed corresponds to cDNA labeled with Cy5-dCTP, and the second represents cDNA that has been labeled with Cy3-dCTP. Equal amounts of the two types of cDNA were mixed and hybridized to the same array. After normalization, the results are always expressed as cpsΔ/wt. A black box indicates that the effect of the cps deletion on gene expression is less than 1.5-fold. (C) The mRNA level for each gene in a cps deletion strain was calculated, after normalization, relative to that of the same gene in a wild-type strain. Using scatter plots in which each point represents one gene, these data were then used to graphically compare the effect of cps50 (003) deletion with the effects of cps40 (138) deletion.

